Technical Analysis for Beginners: The Backbone of Smart Crypto Trading

Technical analysis is one of those must-have skills if you’re serious about cryptocurrency trading. It’s all about looking at past price data and trading volume to get a sense of where the market might be headed next. By learning to read crypto charts, using key indicators, and spotting patterns, you can make smarter decisions in a market that’s known for being unpredictable. In other words, mastering these tools gives you a much better shot at success in the wild world of crypto trading.
Why Chart Reading Matters in Cryptocurrency Trading
First up: charts. Understanding how to read crypto charts is key to grasping what’s happening in the cryptocurrency market. There are several types of charts, but here are the ones you’ll rely on most in your crypto trading journey:
Line Charts
These charts are the simplest and show the closing price of a cryptocurrency over time. While they give you a quick overview of trends, they don’t provide detailed information about the price movements within each time frame.

Bar Charts
Bar charts offer more detail by displaying the open, high, low, and close (OHLC) prices. This helps you see the range of prices during specific periods, which is crucial for identifying market volatility.

Candlestick Charts
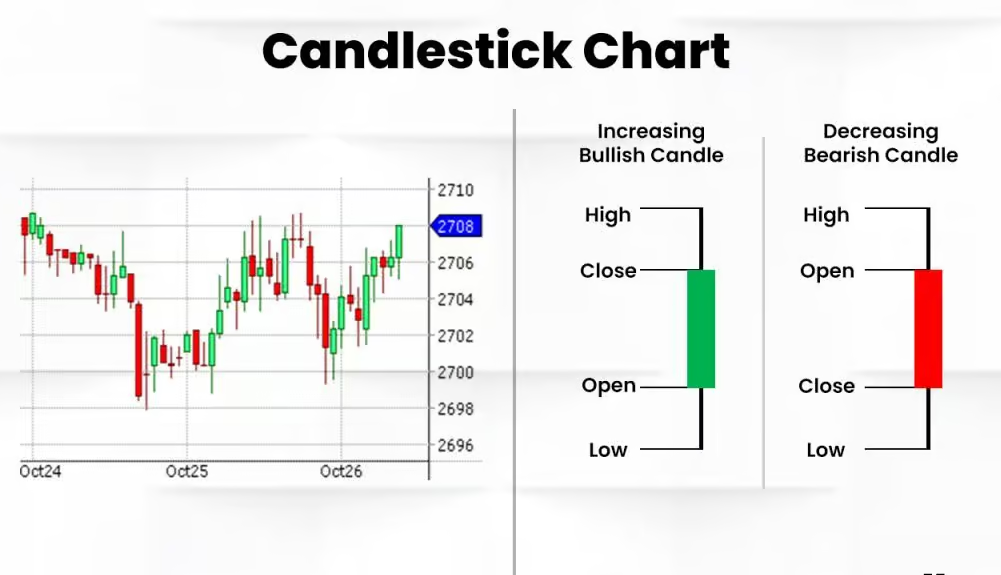
Candlestick charts are a favorite among crypto traders because they pack a lot of information into a simple format. Each candlestick shows the OHLC prices for a specific period. A green (or white) candlestick means the price went up, while a red (or black) candlestick indicates a price drop. The wicks (or shadows) represent the highest and lowest prices during the period. For instance, if you spot several green candlesticks with long lower wicks, it suggests that buyers are stepping in whenever the price dips, which could signal an uptrend in the cryptocurrency market.
Using Indicators: Essential Tools for Crypto Trading
Once you’re comfortable with reading charts, it’s time to add some tools to your crypto trading strategy—indicators. These are like the instruments on a pilot’s dashboard, helping you interpret the data in front of you.
Moving Averages (MA)
Moving averages smooth out price data to highlight the overall trend. If the price stays above a 50-day moving average, it’s usually a sign of a bullish trend. Moving averages are an essential part of any crypto trading strategy, helping you identify the direction of the market.
Example: If Ethereum (ETH) has consistently stayed above its 50-day moving average, this might suggest a strong upward trend, making it a potentially good time to buy.
Relative Strength Index (RSI)
The RSI measures market momentum by indicating whether a cryptocurrency is overbought or oversold. It ranges from 0 to 100, with readings above 70 suggesting overbought conditions (a potential sell signal) and readings below 30 indicating oversold conditions (a potential buy signal).
Example: Suppose you’re analyzing Cardano (ADA) and notice that the RSI has dipped below 30. This could be a clue that the asset is oversold and may be primed for a rebound, presenting a buying opportunity in your crypto trading strategy.
Moving Average Convergence Divergence (MACD)
Don’t be intimidated by the name—MACD is simply a way to track market momentum. When the MACD line crosses above the Signal line, it indicates a bullish signal (time to consider buying). A cross below signals a bearish trend (time to consider selling).
Example: If you’re looking at Ripple (XRP) and see that the MACD line has just crossed above the Signal line, it might suggest that XRP is gaining upward momentum, which could be a good time to enter a trade.
Recognizing Patterns: Predicting Cryptocurrency Market Movements
Chart patterns are another crucial aspect of technical analysis in crypto trading. These patterns are formed by the price movements of cryptocurrencies over time and can help you predict future market behavior.
Head and Shoulders
The head and shoulders pattern is a handy tool for traders looking to figure out when to jump in or out of the market. Picture this: the price takes a dip, then makes a bit of a comeback. This pattern has three main points—the two smaller ones are the “shoulders,” and the big one in the middle is the “head.” When the price drops below what’s called the neckline, it’s often a signal that the trend might be about to change direction. The pattern looks like—yep, you guessed it—a head and shoulders, which is where it gets its name.
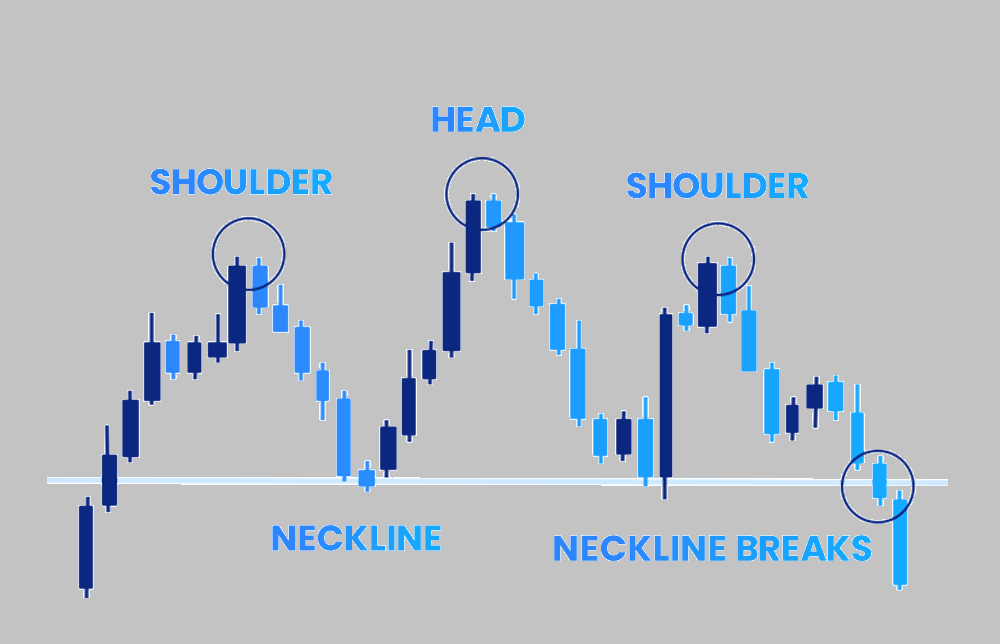
Example: If you see a head and shoulders pattern forming on Litecoin (LTC) and the price breaks below the neckline, it could indicate that a downtrend is coming, making it a good time to consider selling or shorting.
Double Tops and Bottoms
A double top is a bearish pattern that forms when the price hits the same high twice but fails to break through resistance. A double bottom, on the other hand, is bullish and occurs when the price hits the same low twice and holds firm, suggesting it might be ready to climb.
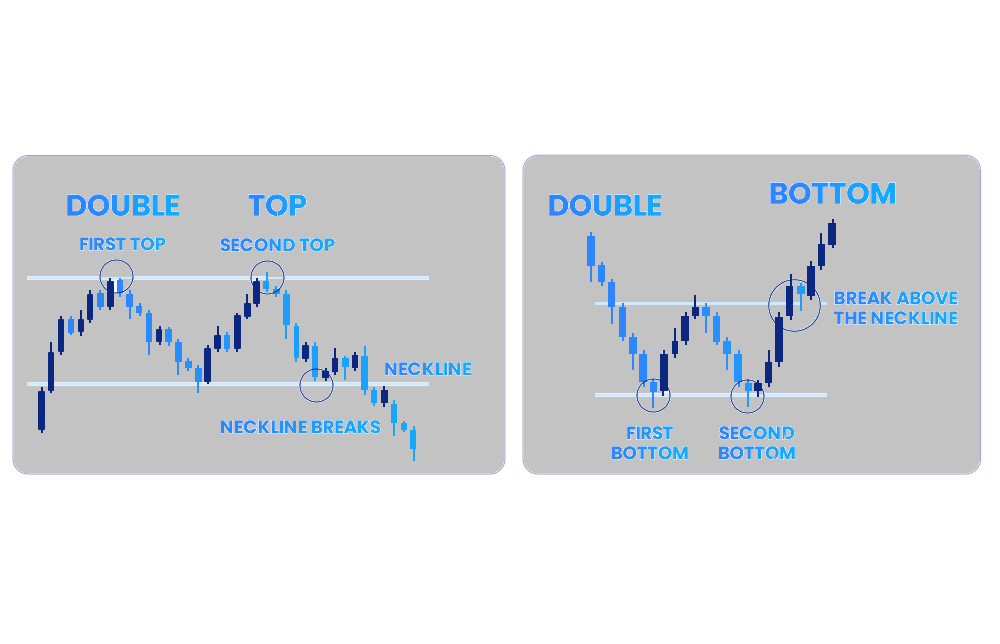
Example: If you’re analyzing Binance Coin (BNB) and notice it bouncing off a support level twice, forming a double bottom, this could signal that the downtrend is losing steam and a bullish reversal might be on the horizon.
Triangles (Ascending, Descending, Symmetrical)
Triangles are continuation patterns that indicate a period of consolidation before the price breaks out in the direction of the previous trend. Ascending triangles are bullish, descending triangles are bearish, and symmetrical triangles can break out in either direction.
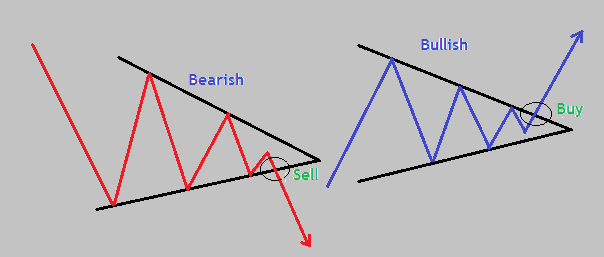
Example: If you spot an ascending triangle on Polkadot (DOT), and the price breaks above the resistance line as it nears the apex, it could signal a strong upward move, making it a good time to buy.
Bringing It All Together: Mastering Technical Analysis for Successful Crypto Trading
Technical analysis is essential for anyone serious about succeeding in cryptocurrency trading. By learning to read charts, use indicators, and recognize patterns, you can develop a crypto trading strategy that’s based on data and informed predictions, rather than mere guesswork.
Remember, the crypto market is unpredictable, but by mastering these essential skills, you’ll be better equipped to navigate its ups and downs. Think of it like learning to read the weather before heading out on a hike—you’ll be better prepared, and your trading journey will be much smoother. With practice, these tools will become second nature, helping you make smarter trades and ultimately succeed in the exciting world of cryptocurrency trading.


