How to Use Moving Averages for Crypto Trading

Understanding Moving Averages in Crypto Trading
What Are Moving Averages?
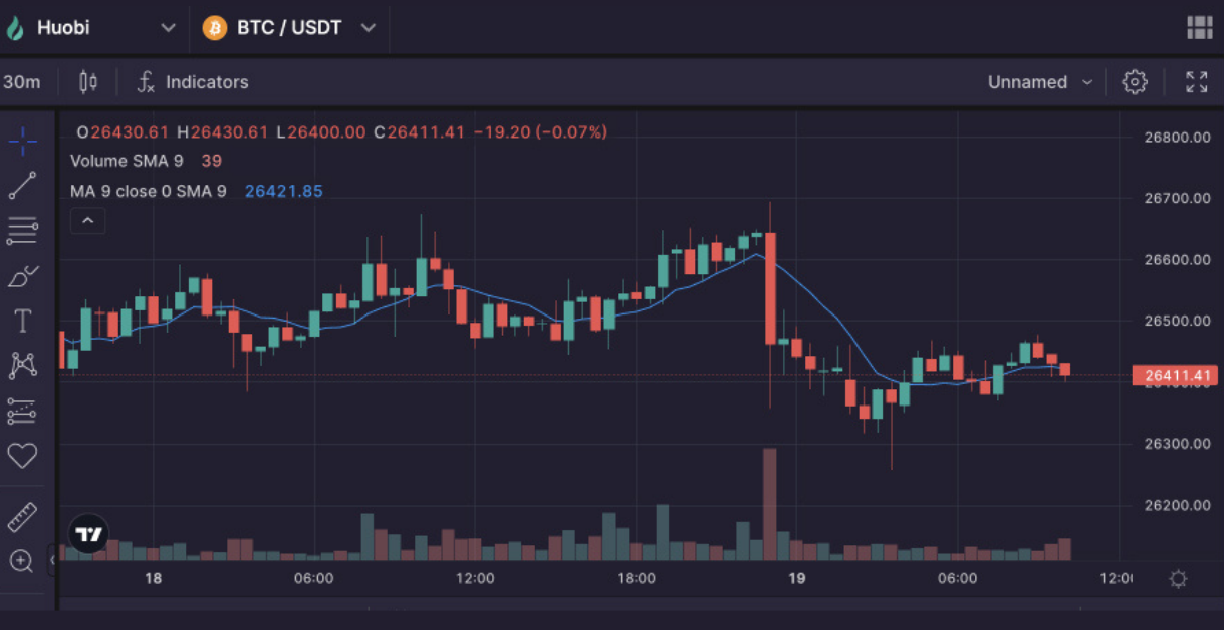
Moving averages (MAs) are one of the most commonly used indicators in the world of trading, including crypto trading. In simple terms, a moving average is a calculation that helps smooth out price data over a specified period, creating a line that traders can use to identify trends. By averaging out the data points, moving averages allow traders to filter out the “noise” from random price fluctuations, giving them a clearer picture of the overall direction of the market.
Importance of Moving Averages in Crypto Trading
Why do traders love moving averages so much? It’s because they serve as a versatile tool that can be used to identify trends, spot potential reversal points, and even develop entry and exit strategies. In the volatile world of cryptocurrency, where prices can swing wildly in short periods, moving averages provide a way to see beyond the chaos and make informed decisions.
How Moving Averages Work
Moving averages work by calculating the average of a specific number of past data points (like closing prices) over a set period. As new data points become available, the oldest data point is dropped, and the new one is added, hence the term “moving.” This continuous update gives traders a current view of market trends, making it easier to determine whether the market is in an uptrend, downtrend, or moving sideways.
Types of Moving Averages
Simple Moving Average (SMA)
The Simple Moving Average (SMA) is the most straightforward type of moving average. It is calculated by taking the sum of the closing prices over a specific number of periods and dividing that sum by the number of periods. For example, if you want to calculate a 10-day SMA, you would sum up the closing prices of the last 10 days and then divide by 10.
Pros and Cons of SMA in Crypto Trading
The simplicity of the SMA is its greatest strength and its biggest weakness. On one hand, it’s easy to calculate and understand, making it a favorite among beginner traders. On the other hand, the SMA gives equal weight to all data points, which can be a drawback in a market as dynamic as crypto. This means that older data can have as much influence as more recent data, which may not accurately reflect the current market conditions.
Exponential Moving Average (EMA)
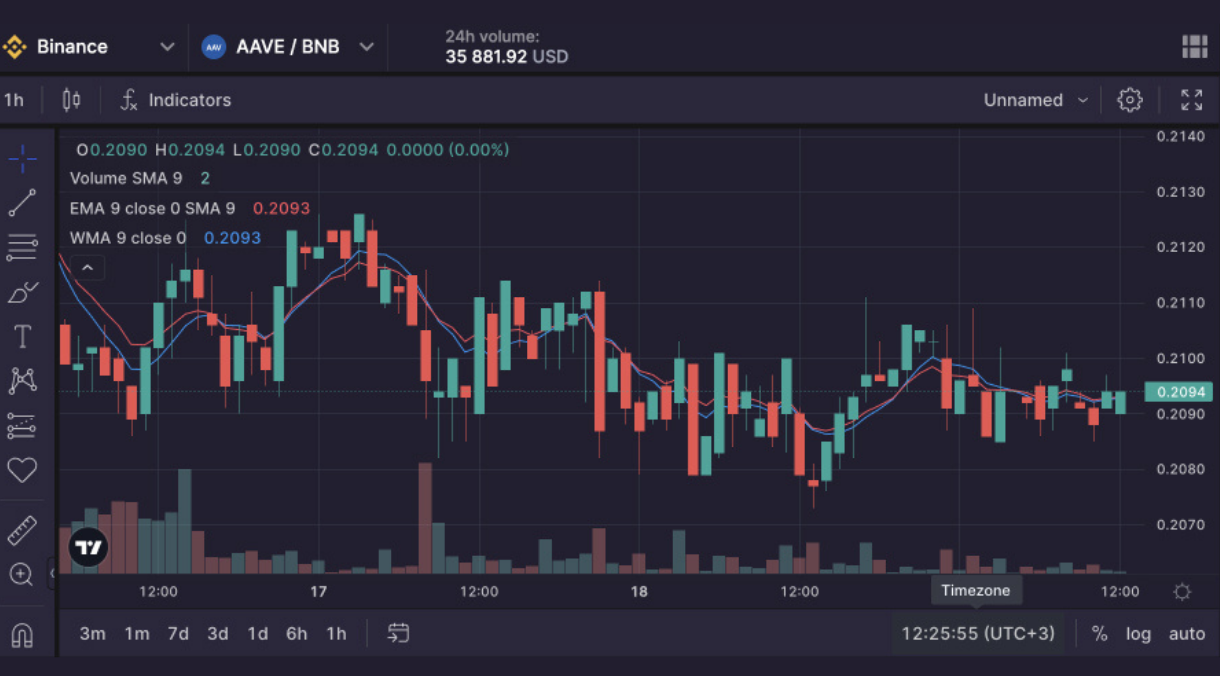
The Exponential Moving Average (EMA) is similar to the SMA, but with a twist: it gives more weight to the most recent prices. This means that the EMA reacts more quickly to price changes than the SMA, making it more responsive to short-term market movements. The formula for EMA is a bit more complex, involving a multiplier that adjusts how much weight is given to recent prices.
Why EMA Is Preferred for Crypto Trading
In the fast-paced world of cryptocurrency trading, where prices can change rapidly, the EMA is often preferred over the SMA because it better captures the current market sentiment. By giving more importance to recent prices, the EMA provides a more accurate reflection of the current trend, making it a valuable tool for traders looking to make quick decisions.
Comparing EMA and SMA: Which is Better?
So, which one should you use? It depends on your trading style. If you’re more focused on long-term trends and don’t mind a bit of lag, the SMA might be for you. But if you’re a short-term trader who needs to react quickly to market changes, the EMA could be your best bet. Many traders use both in conjunction to get a fuller picture of the market.
Weighted Moving Average (WMA)
Understanding WMA
The Weighted Moving Average (WMA) takes the concept of the EMA a step further by assigning even more weight to recent prices. Unlike the SMA, where all data points are equally weighted, and the EMA, where recent prices are more heavily weighted, the WMA assigns a different weight to each data point, with the most recent receiving the highest weight.
Application of WMA in Crypto Trading
The WMA is particularly useful in volatile markets like crypto, where recent price action can be a better indicator of future movements. By focusing more on the latest data, the WMA can help traders make more timely decisions. However, like all moving averages, it has its drawbacks, such as being more sensitive to short-term fluctuations, which can sometimes lead to false signals.
Using Moving Averages for Crypto Trading
How to Set Up Moving Averages on Your Trading Platform
Step-by-Step Guide to Setting Up MA Indicators
Setting up moving averages on your trading platform is straightforward, but the steps can vary depending on the platform you’re using. Generally, you’ll need to go to the “Indicators” section, select “Moving Average,” and then choose the type (SMA, EMA, WMA) and the period (e.g., 10, 50, 200 days). After that, the moving average will appear as a line on your price chart.
Choosing the Right Time Frames
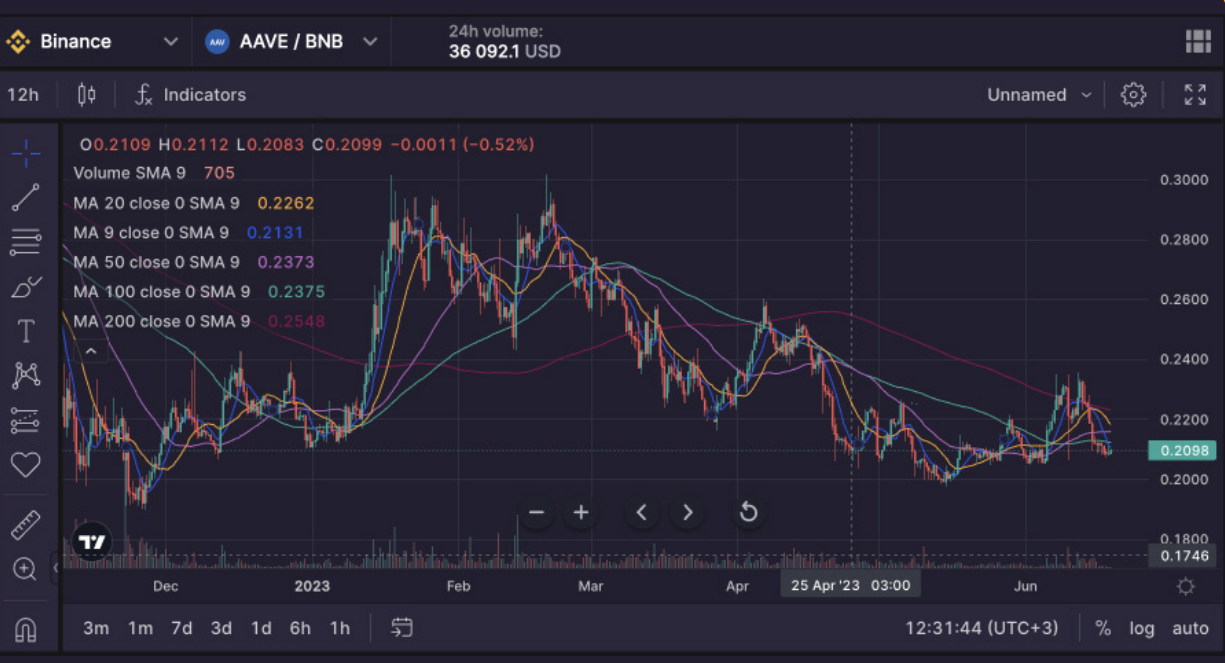
The time frame you choose for your moving average depends on your trading strategy. Short-term traders might use a 10-day or 20-day moving average, while long-term traders might prefer a 50-day or 200-day moving average. It’s also common to use multiple moving averages with different time frames to identify both short-term and long-term trends.
Trading Strategies Using Moving Averages
The Golden Cross and Death Cross Strategy
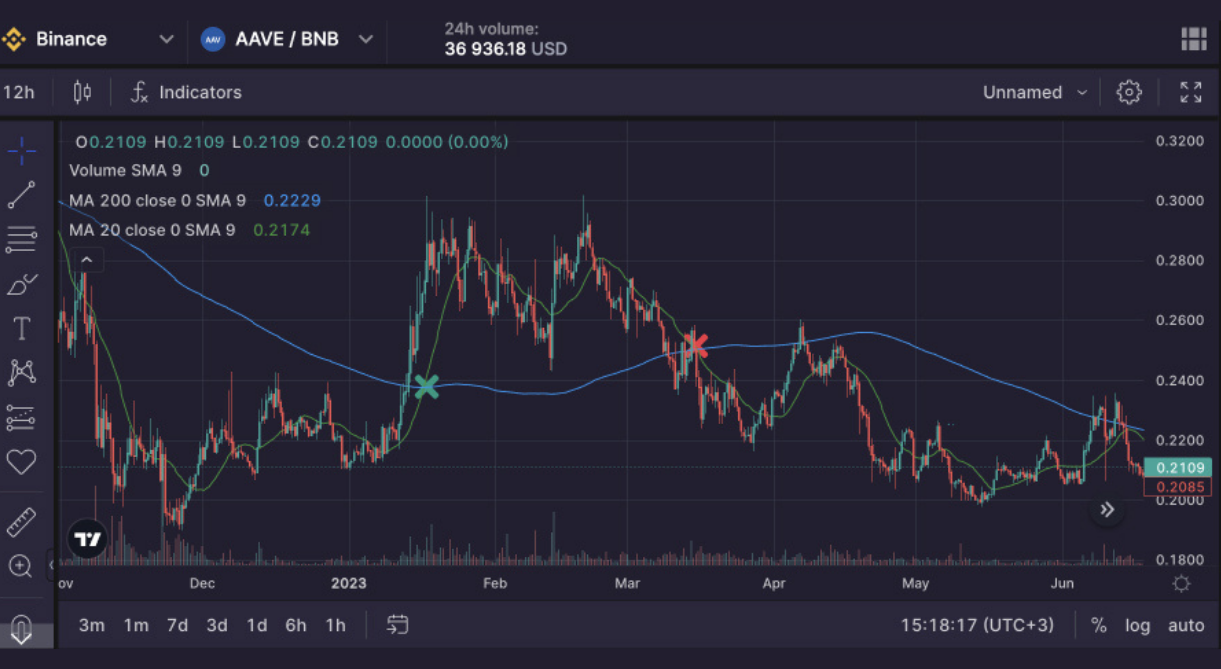
One of the most popular moving average strategies is the Golden Cross and Death Cross. A Golden Cross occurs when a short-term moving average (like the 50-day MA) crosses above a long-term moving average (like the 200-day MA). This is often seen as a bullish signal, indicating a potential upward trend. Conversely, a Death Cross occurs when the short-term MA crosses below the long-term MA, signaling a potential downward trend.
The Moving Average Crossover Strategy
The Moving Average Crossover Strategy involves using two or more moving averages to identify trading opportunities. For example, when a shorter MA crosses above a longer MA, it may indicate a good time to buy, while the opposite may signal a sell. This strategy is particularly effective in trending markets, where prices move steadily in one direction.
The Support and Resistance Strategy
Moving averages can also act as dynamic support and resistance levels. When the price of a cryptocurrency approaches a moving average, it might bounce off it, as the MA acts as a support or resistance level. Traders can use this to their advantage by entering or exiting trades when the price touches these levels.
Combining Moving Averages with Other Indicators
Moving Averages and RSI
The Relative Strength Index (RSI) is another popular indicator that measures the speed and change of price movements. When combined with moving averages, it can provide a more comprehensive view of market conditions. For example, if the RSI indicates that a cryptocurrency is overbought and the price is near a moving average resistance level, it might be a good time to sell.
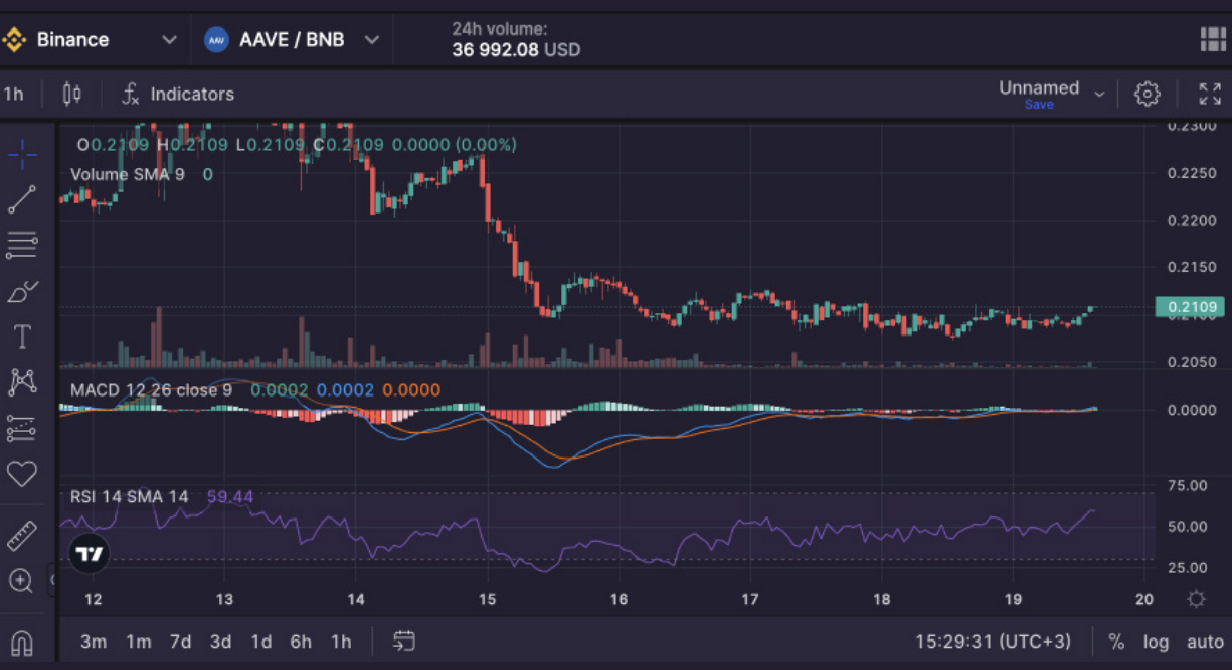
Moving Averages and MACD
The Moving Average Convergence Divergence (MACD) is a momentum indicator that shows the relationship between two moving averages of a security’s price. When combined with a moving average, the MACD can help traders identify potential buy and sell signals by analyzing the strength and direction of a trend.
The Power of Multi-Indicator Strategies
Using moving averages in combination with other indicators can significantly increase the accuracy of your trading signals. This approach, known as a multi-indicator strategy, allows traders to confirm their decisions with multiple data points, reducing the likelihood of false signals.
Advanced Concepts
The Double Moving Average Strategy
How It Works
The Double Moving Average Strategy involves using two moving averages: a shorter one to track the short-term trend and a longer one to track the long-term trend. Traders look for crossovers between these two MAs to identify potential trading opportunities. For instance, if the short-term MA crosses above the long-term MA, it could be a signal to buy.
Best Practices for Using Double MAs
When using the Double MA Strategy, it’s crucial to choose the right time frames for your moving averages. A common approach is to use a 50-day MA for the short term and a 200-day MA for the long term. This strategy works best in trending markets, so be cautious in sideways markets where false signals are more likely.
The Triple Moving Average Strategy
How It Differs from the Double MA
The Triple Moving Average Strategy adds a third MA to the mix, providing an even more nuanced view of the market. Typically, traders use a short-term, medium-term, and long-term MA to track trends across different time frames. The idea is that when all three MAs align in the same direction, it confirms the strength of the trend.
When to Use the Triple Moving Average
The Triple MA Strategy is particularly useful in volatile markets, where trends can change rapidly. By using three MAs, traders can avoid some of the whipsaws (false signals) that are common with single or double MAs. However, it can also be more complex to manage, so it’s best suited for experienced traders.
Avoiding Common Pitfalls with Moving Averages
Over-Reliance on Moving Averages
While moving averages are powerful tools, relying on them too much can be dangerous. They are lagging indicators, meaning they reflect past price data, not future movements. This can lead to missed opportunities or false signals if used in isolation. Always consider using other indicators and market analysis in conjunction with moving averages.
Adjusting for Market Volatility
Cryptocurrency markets are known for their volatility, and moving averages can sometimes struggle to keep up. To account for this, traders might adjust the time frames of their MAs or combine them with other indicators that are more responsive to rapid price changes. Flexibility and continuous learning are key to successfully using moving averages in such a dynamic environment.
Real-Life Examples of MA Strategies in Crypto Trading
Case Study: Bitcoin
Bitcoin’s historical price data shows multiple instances where the Golden Cross signaled the beginning of major bull runs, most notably in 2015 and 2019.
Case Study: Ethereum
Ethereum often follows Bitcoin’s trends but with greater volatility. Using EMA crossovers has been particularly effective in capturing short-term price movements in ETH.
Case Study: Altcoins
For altcoins, where volatility is even higher, EMA strategies on shorter timeframes (like 4-hour or 1-hour charts) can provide more reliable signals.
Conclusion
Summary of Moving Averages in Crypto Trading
Moving averages are a fundamental tool in crypto trading, offering insights into market trends and helping traders make informed decisions. Whether you’re using a simple, exponential, or weighted moving average, each has its unique advantages and can be tailored to suit your trading style. The key is to understand how each type works and how to integrate them into a broader trading strategy.
Key Takeaways
- Moving averages smooth out price data, helping to identify trends.
- SMA, EMA, and WMA each have their strengths, depending on market conditions.
- Combining moving averages with other indicators can enhance your trading accuracy.
- Advanced strategies like Double and Triple MAs provide a deeper market analysis.
- Avoid common pitfalls by not over-relying on MAs and adjusting for market volatility.
FAQs
What is the best moving average for crypto trading?
There isn’t a one-size-fits-all answer; it depends on your trading strategy. For short-term trades, the EMA is often preferred due to its responsiveness to recent price changes. For long-term trends, the SMA or a combination of both might be more suitable.
How do I choose the right time frame for my moving averages?
Your choice should reflect your trading style. Day traders might use shorter time frames like 10-day or 20-day MAs, while long-term investors might prefer 50-day or 200-day MAs.
Can moving averages predict crypto price movements?
Moving averages are lagging indicators, meaning they reflect past price data. While they can help identify trends, they should not be solely relied upon to predict future price movements.
What is the difference between a simple and exponential moving average?
The main difference lies in how they weight data. The SMA gives equal weight to all data points, while the EMA gives more weight to recent prices, making it more responsive to current market conditions.
How often should I update my moving average settings?
Your settings should be reviewed regularly, especially in highly volatile markets like crypto. As market conditions change, you might need to adjust the time frames or type of moving average to stay aligned with the current trend.


