Stochastic Oscillator: How It Works

Introduction to the Stochastic Oscillator
What is the Stochastic Oscillator?
Have you ever wondered how traders predict market movements with such precision? One of their secret weapons is the Stochastic Oscillator. It’s a momentum indicator that compares a stock’s closing price to its price range over a specified period. In simpler terms, it helps traders spot when an asset is overbought or oversold, giving them an edge in timing their trades. Whether you’re new to trading or a seasoned pro, understanding this tool can boost your market game significantly.
Brief History and Development
Developed in the 1950s by George Lane, the Stochastic Oscillator was designed to track the speed or momentum of price action. Lane believed that momentum changes direction before price, making it a leading indicator. Over the decades, it has stood the test of time, proving its reliability across various market conditions and asset classes.
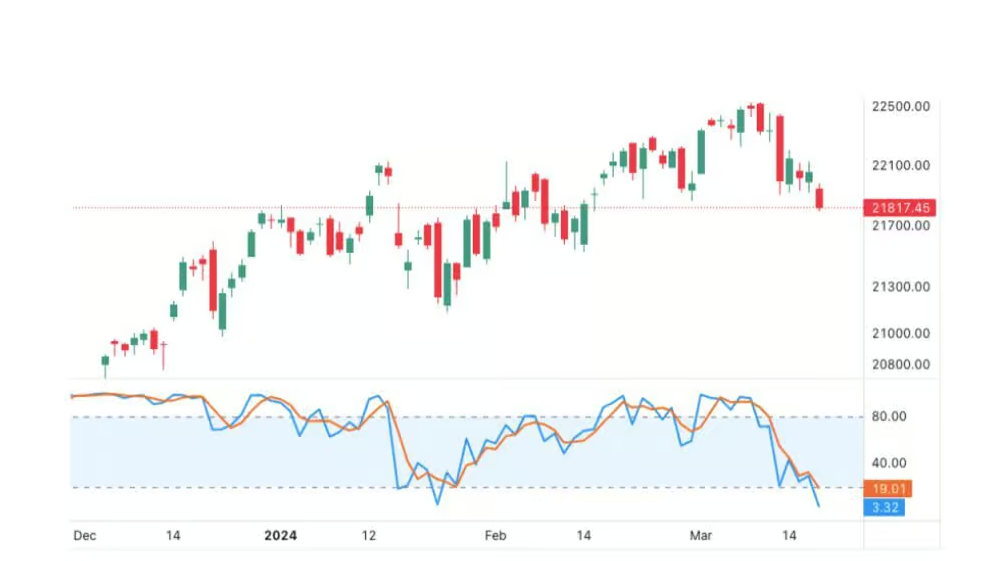
How Does the Stochastic Oscillator Work?
The Basics of the Formula
At its core, the Stochastic Oscillator formula involves two lines: %K and %D. The %K line is the faster, more sensitive line, while %D is a moving average of %K, which acts as a signal line. The calculation is straightforward:
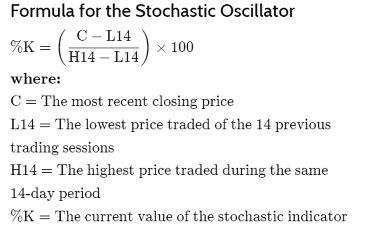
The result is a percentage that oscillates between 0 and 100, indicating how close the current price is to the extremes of the chosen period.
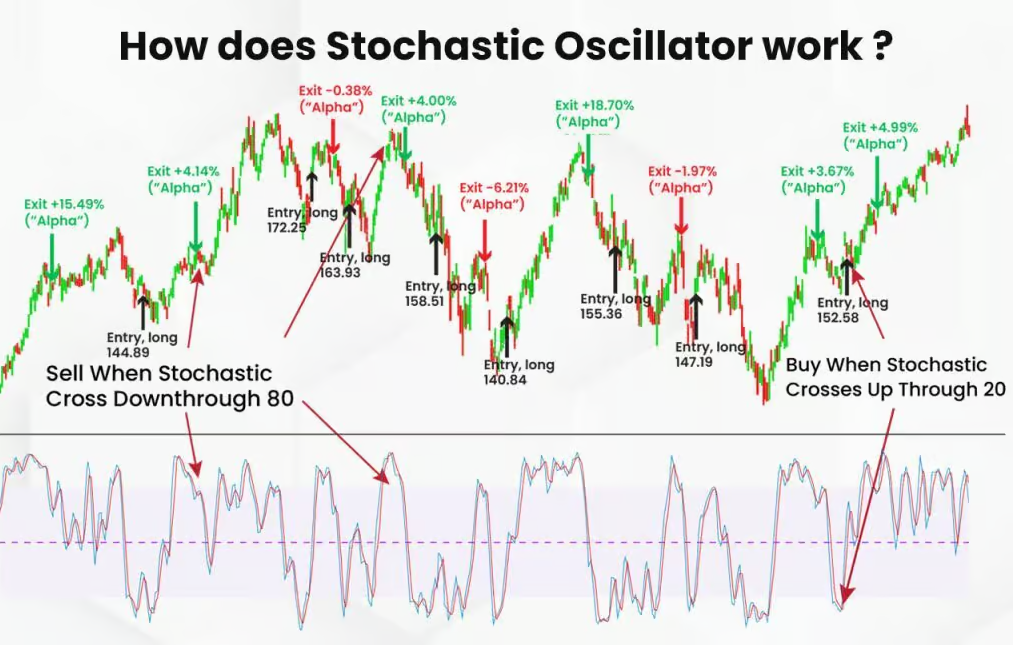
The Role of %K and %D Lines
These lines work together to provide trading signals. When the %K line crosses above the %D line, it suggests a potential buying opportunity, signaling that the market might be oversold. Conversely, when %K crosses below %D, it could be time to sell, as the market might be overbought.
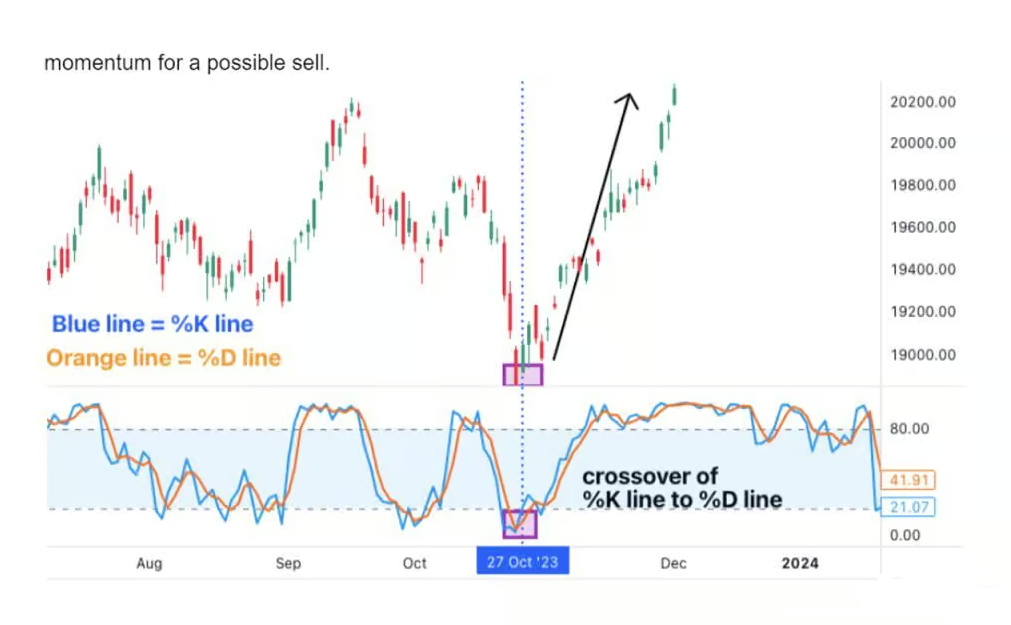
Key Components of the Stochastic Oscillator
Fast, Slow, and Full Stochastic Oscillators
There are three types of Stochastic Oscillators: Fast, Slow, and Full. The Fast Stochastic uses the raw %K and %D lines and is highly sensitive to price changes. The Slow Stochastic smooths out these lines, reducing sensitivity to avoid false signals. The Full Stochastic adds even more flexibility, allowing traders to adjust both the %K and %D smoothing periods.
Understanding the Overbought and Oversold Levels
A Stochastic Oscillator reading above 80 typically indicates that the asset is overbought, suggesting a potential sell signal. A reading below 20, on the other hand, points to an oversold condition, hinting at a buying opportunity. However, it’s essential to remember that these levels are not hard rules but guidelines; markets can remain overbought or oversold longer than expected.
Why Use the Stochastic Oscillator in Trading?
Benefits of Using the Stochastic Oscillator
The Stochastic Oscillator is popular for several reasons. First, it’s relatively easy to understand, making it accessible for beginners. It also adapts well to various market conditions, whether trending or ranging. Plus, it provides early signals, allowing traders to enter or exit positions before significant price moves.
Limitations and Considerations
However, no indicator is perfect. The Stochastic Oscillator can generate false signals, especially in highly volatile or choppy markets. It’s also not ideal as a standalone tool; combining it with other indicators or analysis methods often yields better results.
Practical Applications of the Stochastic Oscillator
Setting Up the Stochastic Oscillator on Trading Platforms
Step-by-Step Guide for Popular Platforms
Most trading platforms, like MetaTrader, TradingView, and ThinkorSwim, offer built-in Stochastic Oscillator tools. To set it up, navigate to the indicators section, select “Stochastic Oscillator,” and adjust the settings to your preference. Typically, the default settings are 14 for the look-back period, 3 for %K, and 3 for %D.
Customizing the Settings for Optimal Results
Adjusting the oscillator settings can fine-tune its responsiveness. For example, a shorter look-back period makes the indicator more sensitive, suitable for day trading. A longer period smooths the oscillations, better for swing trading or longer-term analysis.
How to Interpret the Stochastic Oscillator Signals
Bullish and Bearish Divergences
One powerful way to use the Stochastic Oscillator is by identifying divergences. A bullish divergence occurs when the price makes a new low, but the Stochastic does not, indicating potential upward momentum. Conversely, a bearish divergence happens when the price hits a new high, but the Stochastic does not follow suit, suggesting weakening upward momentum.
Signal Line Crossovers
Another common strategy is to watch for crossovers between the %K and %D lines. A crossover of %K above %D is a buy signal, while %K crossing below %D suggests selling. These crossovers are more reliable when confirmed by other indicators or market analysis.
Stochastic Oscillator Trading Strategies
Range-Bound Trading Strategy
In range-bound markets, the Stochastic Oscillator can be a reliable guide. Traders look for overbought signals near resistance and oversold signals near support, entering trades accordingly. This approach capitalizes on the oscillator’s strength in non-trending environments.
Combining with Other Indicators for Better Accuracy
Stochastic and Moving Averages
Combining the Stochastic Oscillator with moving averages can help smooth out signals and reduce noise. For instance, if both the Stochastic and a simple moving average (SMA) suggest a bullish trend, the trade setup becomes more robust. Moving averages can help confirm the direction, making the Stochastic Oscillator’s signals more reliable.
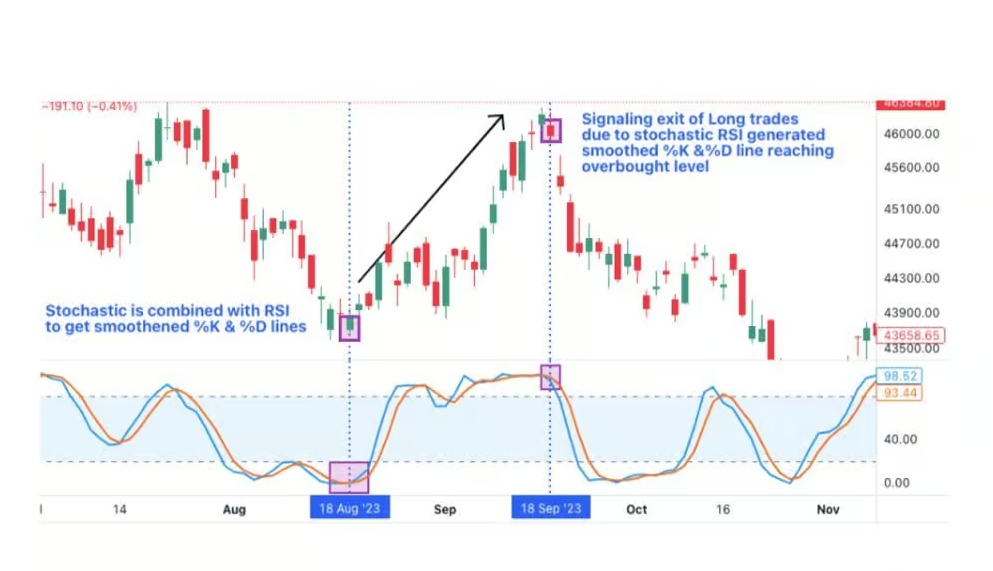
Stochastic and RSI (Relative Strength Index)
Another powerful combination is the Stochastic Oscillator and RSI. While both are momentum indicators, they measure different things: Stochastic looks at price relative to the range, and RSI measures the speed of price changes. Using them together can provide a more comprehensive view, reducing the chances of acting on false signals.
Common Mistakes to Avoid When Using Stochastic Oscillator
Relying Solely on Stochastic Signals
One common pitfall is relying solely on the Stochastic Oscillator for trading decisions. While it’s a powerful tool, it works best when combined with other indicators or analysis methods. Remember, no single indicator is foolproof—diversifying your analysis can help confirm signals and improve accuracy.
Ignoring Market Conditions and Trends
Ignoring broader market trends can lead to poor trading decisions. For instance, during strong trending markets, the Stochastic Oscillator may remain in overbought or oversold territory for extended periods, generating false signals. Always consider the overall market context when using Stochastic signals.
Advanced Tips for Using the Stochastic Oscillator
Fine-Tuning the Stochastic Oscillator
Adjusting Timeframes for Different Markets
Traders can adapt the Stochastic Oscillator to various markets by tweaking the timeframes. Shorter timeframes are suitable for fast-paced environments like forex or intraday stock trading, while longer timeframes work well for commodities or indices.
Advanced Techniques for Experienced Traders
Seasoned traders might use advanced techniques, such as combining multiple Stochastic Oscillators with different settings to filter out noise and enhance signal quality. Another approach is using the oscillator’s readings to adjust stop-loss levels dynamically.
Common Myths and Misconceptions
Debunking Stochastic Oscillator Myths
One common myth is that the Stochastic Oscillator predicts market reversals. In reality, it signals potential changes in momentum, which can precede reversals but aren’t guaranteed. Another misconception is that high readings always mean an immediate price drop; prices can remain high while the oscillator stays overbought.
Understanding Its True Potential and Limitations
The Stochastic Oscillator’s true strength lies in its ability to highlight momentum shifts, not in making precise predictions. It’s a tool that complements other strategies and indicators, providing context rather than certainty.
Conclusion
The Stochastic Oscillator is a versatile and widely-used momentum indicator that helps traders identify overbought and oversold conditions in the market. By understanding how it works and integrating it with other tools, traders can improve their market entries and exits, making more informed decisions.
Final Thoughts on Using the Stochastic Oscillator
While the Stochastic Oscillator is powerful, it’s essential to remember that no single indicator is a magic bullet. Use it as part of a broader trading strategy, and always consider the bigger picture. With practice and the right approach, it can become a valuable part of your trading toolkit.
FAQs
- What is the best setting for the Stochastic Oscillator?
The default setting of 14 periods for the look-back, 3 for %K, and 3 for %D works well for most situations, but you can adjust these settings based on your trading style and market conditions. - How can I use the Stochastic Oscillator for day trading?
For day trading, consider using a shorter look-back period to make the indicator more responsive to price changes. Pair it with other indicators like moving averages to confirm signals. - Is the Stochastic Oscillator suitable for beginners?
Yes, it’s beginner-friendly due to its straightforward concept and visual cues. However, beginners should combine it with other analysis methods and avoid relying solely on its signals. - What are the differences between the Stochastic Oscillator and RSI?
Both are momentum indicators, but they measure different aspects. The Stochastic Oscillator focuses on price relative to its range, while RSI measures the speed of price changes. They can be used together for a more comprehensive analysis. - Can the Stochastic Oscillator be used in all market conditions?
While it’s versatile, the Stochastic Oscillator performs best in range-bound markets. In trending markets, it’s better used alongside trend-following indicators to avoid false signals.


