Harmonic Patterns: A Complete Guide to Understanding and Using Them in Trading

Are you tired of chasing the market with no clear strategy? Well, you’re not alone! Many traders struggle to find patterns that provide reliable trading signals. But here’s the good news: harmonic patterns might be just what you need. These patterns are like a roadmap, guiding you through the chaotic world of trading by using specific price movements that repeat over time. Intrigued? Let’s dive into the world of harmonic patterns!
What Are Harmonic Patterns?
Harmonic patterns are specific formations that appear on price charts, utilizing Fibonacci sequences to predict future price movements. Think of them as the secret language of the market—a language that, once learned, can give you an edge in your trading game. They rely on precise calculations and ratios, making them a fascinating combination of art and math.
The History and Origin of Harmonic Patterns
The concept of harmonic patterns dates back to the early 1930s, thanks to the pioneering work of H.M. Gartley, who first introduced these patterns in his book “Profits in the Stock Market.” Since then, traders and analysts have refined and expanded upon Gartley’s work, creating various patterns that are now widely used in technical analysis.
Why Are Harmonic Patterns Important in Trading?
Harmonic patterns are crucial because they provide traders with a systematic approach to predicting market reversals. By recognizing these patterns, traders can enter and exit positions with greater confidence, often leading to more profitable outcomes. They essentially turn the chaos of market data into clear, actionable insights.
The Basic Concepts of Harmonic Patterns
Before you can start using harmonic patterns, it’s essential to understand their core components. These include Fibonacci ratios, pattern structures, and the unique features that distinguish each pattern.
Fibonacci Ratios in Harmonic Patterns
Fibonacci ratios, such as 0.618 and 1.618, play a pivotal role in harmonic patterns. These ratios are derived from the Fibonacci sequence, a mathematical series that appears in nature, art, and financial markets. In trading, these ratios help determine potential reversal points by measuring the depth of retracements and extensions within a price movement.
The Key Components of Harmonic Patterns
Every harmonic pattern consists of five points labeled X, A, B, C, and D. These points connect to form four legs: XA, AB, BC, and CD. The position and length of these legs relative to each other determine the type of harmonic pattern and its potential effectiveness. Precision is key; even slight deviations can impact the pattern’s reliability.
Common Misconceptions About Harmonic Patterns
A common misconception is that harmonic patterns guarantee successful trades. However, like any trading tool, they are not foolproof. They should be used as part of a broader strategy that includes risk management and market analysis. It’s also a myth that harmonic patterns are only for expert traders—they can be learned and used effectively by anyone willing to put in the effort.
Popular Harmonic Patterns Explained
Let’s explore some of the most popular harmonic patterns you’re likely to encounter. Each pattern has its unique characteristics and trading strategies.
Gartley Pattern
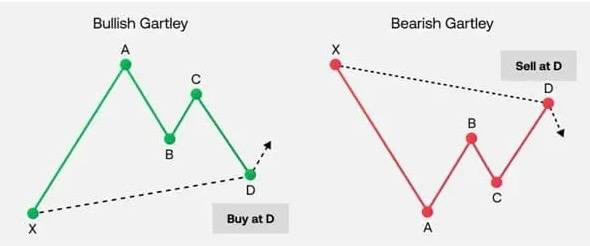
The Gartley pattern is one of the most well-known harmonic patterns. It resembles an “M” or “W” shape and indicates a potential reversal point.
Identification and Key Features
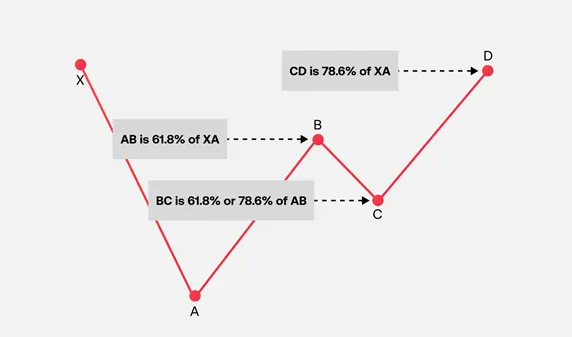
- The Gartley pattern begins with an initial leg (XA), followed by a retracement (AB), another move (BC), and a final leg (CD).
- The critical ratios to watch are a 61.8% retracement of the XA leg for AB, and 78.6% retracement of XA for the final CD leg.
Trading the Gartley Pattern
To trade the Gartley pattern, wait for the pattern to complete at point D and look for price action confirmation. This might include candlestick patterns, such as pin bars or engulfing candles, that signal a reversal.
Bat Pattern
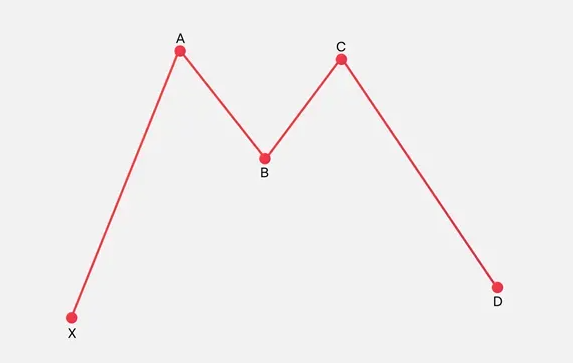
The Bat pattern is similar to the Gartley but differs in the Fibonacci ratios used.
Identification and Key Features
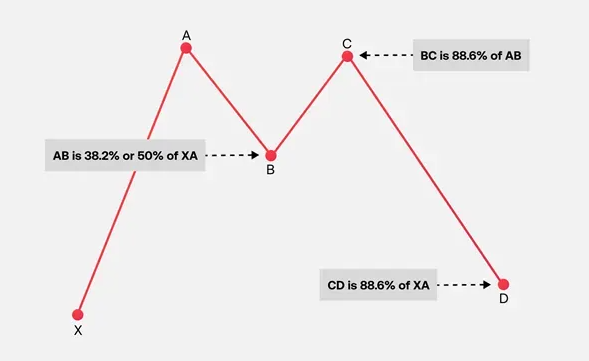
- In a Bat pattern, the retracement of the AB leg is less deep, ideally around 50% of the XA leg.
- The CD leg should extend to 88.6% of the XA leg, which is the defining feature of the Bat pattern.
Trading the Bat Pattern
Trading the Bat pattern involves entering at point D, where the pattern completes, usually aligning with the 88.6% retracement. As always, confirming with price action or other indicators is wise.
Butterfly Pattern
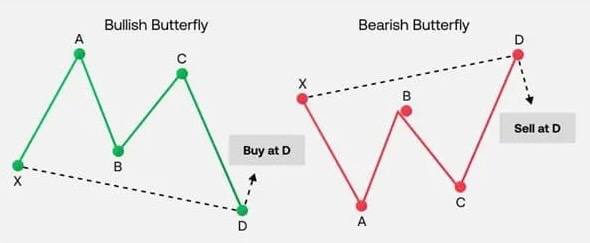
The Butterfly pattern is a more extended pattern compared to the Gartley and Bat, often indicating stronger reversals.
Identification and Key Features
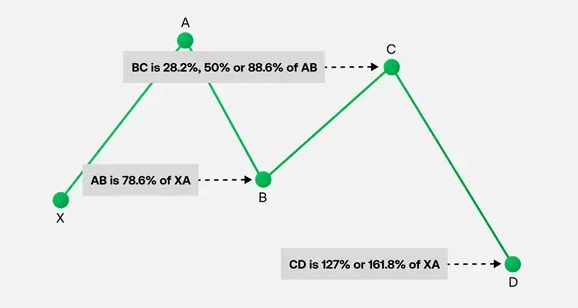
- The AB leg retraces to 78.6% of the XA leg.
- The CD leg extends beyond the initial XA leg to 127.2% or even 161.8%, which sets it apart from other patterns.
Trading the Butterfly Pattern
You’ll want to enter at point D when the price reaches the extension level. Setting a stop loss slightly beyond the extension can help manage risks.
Crab Pattern
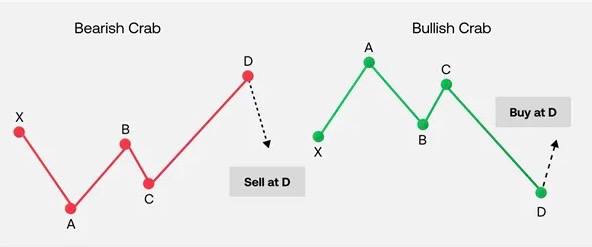
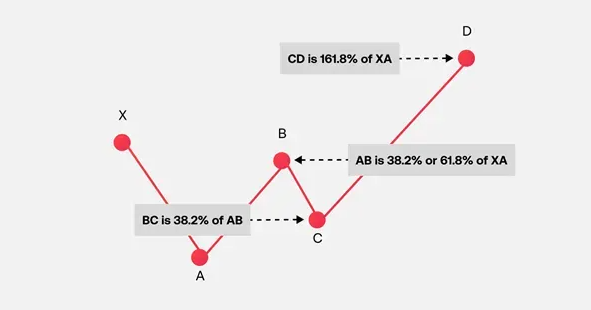
The Crab pattern is known for its deep CD leg, which can extend up to 161.8% of the XA leg.
Identification and Key Features
- The AB leg retraces minimally, often to 38.2% of the XA leg.
- The defining feature is the deep CD extension, often reaching 161.8% of XA.
Trading the Crab Pattern
The ideal entry is at point D, with confirmation needed from other indicators or candlestick patterns. Given the deep extension, it’s crucial to use tight risk management strategies.
How to Identify Harmonic Patterns
Identifying harmonic patterns might seem daunting at first, but with practice and the right tools, it becomes second nature.
Tools and Indicators for Spotting Patterns
There are several tools available to help identify harmonic patterns, including trading software like TradingView and MetaTrader, which offer harmonic pattern indicators. These tools can automatically draw patterns and highlight potential trades, saving you time and effort.
Step-by-Step Guide to Identifying Patterns
- Start with the XA Leg: Identify the initial move, either bullish or bearish.
- Measure Retracements: Use Fibonacci retracement tools to measure subsequent moves.
- Look for Confluence: Check if the retracements and extensions match the specific ratios of a known pattern.
- Wait for Completion: Only consider the pattern valid when it reaches the D point.
Common Mistakes to Avoid When Identifying Patterns
- Forcing Patterns: Not every price movement forms a harmonic pattern. Forcing a pattern can lead to poor trading decisions.
- Ignoring Confirmation: Always confirm patterns with additional analysis, like support/resistance levels or trend lines.
- Overlooking Ratios: Precision is crucial; close enough is not good enough with harmonic patterns.
Trading Strategies with Harmonic Patterns
Knowing how to spot harmonic patterns is only half the battle; you also need a solid strategy to trade them.
Entry and Exit Strategies
The ideal entry is at point D of the pattern, where the price is expected to reverse. Exits can be planned at the 38.2% or 61.8% retracement levels of the CD leg, depending on market conditions and your risk tolerance.
Risk Management Tips
- Set Stop Losses: Place stop losses just beyond point D to protect against unexpected moves.
- Use Position Sizing: Adjust your position size based on your risk appetite and the distance between entry and stop loss.
Combining Harmonic Patterns with Other Technical Indicators
Harmonic patterns work best when combined with other technical tools, such as moving averages, RSI, or MACD. This multi-layered approach can help filter out false signals and increase the likelihood of success.
Advanced Tips for Trading Harmonic Patterns
Once you’re comfortable with the basics, you can start exploring advanced techniques to refine your trading.
Adapting Patterns to Different Markets
While harmonic patterns work across various markets, including forex, stocks, and commodities, each market has its quirks. Adapting your strategy to the market you’re trading can enhance your effectiveness.
Backtesting Your Harmonic Patterns Strategy
Before risking real money, backtest your strategy on historical data. This practice will help you understand how your patterns perform under different market conditions.
Continuous Learning and Pattern Recognition Improvement
Trading is a journey of continuous learning. As you become more familiar with harmonic patterns, you’ll start to recognize subtle variations and improve your ability to spot profitable setups.
Tools and Resources for Mastering Harmonic Patterns
To master harmonic patterns, leverage the right tools and resources.
Recommended Books and Courses
- “Harmonic Trading, Volume One and Two” by Scott Carney
- Online courses on platforms like Udemy or Coursera that focus on harmonic trading strategies.
Software and Tools for Analysis
- TradingView: Offers excellent tools for drawing and analyzing harmonic patterns.
- MetaTrader: Provides indicators that automatically detect harmonic patterns.
Online Communities and Forums
Joining online trading communities can provide valuable insights and feedback. Websites like ForexFactory, TradingView’s community, and Reddit’s r/Forex are great places to start.
Conclusion
Harmonic patterns offer a unique and precise way to navigate the markets. By combining the art of pattern recognition with the science of Fibonacci ratios, you can gain a deeper understanding of market movements and enhance your trading strategy. Remember, the key is practice, patience, and continuous learning. So, start spotting those patterns, backtest your strategies, and watch your trading skills soar!
FAQs
1. What are the most reliable Harmonic Patterns?
The Gartley and Bat patterns are considered among the most reliable due to their well-defined ratios and frequent occurrence.
2. How do Harmonic Patterns differ from other chart patterns?
Harmonic patterns use specific Fibonacci ratios to predict reversals, while other patterns, like head and shoulders, do not rely on these ratios.
3. Can beginners use Harmonic Patterns effectively?
Absolutely! With practice and the right tools, beginners can learn to spot and trade harmonic patterns effectively.
4. How accurate are Harmonic Patterns in predicting market movements?
While no pattern is 100% accurate, harmonic patterns offer high probability setups when identified and traded correctly.
5. Are there any risks associated with trading using Harmonic Patterns?
Yes, like any trading strategy, harmonic patterns involve risks, especially if misidentified. Proper risk management is crucial.


