MACD and Stochastic: A Double-Cross Strategy for Better Trading Signals

Are you ready to level up your trading game? If you’ve ever felt lost trying to figure out the market’s next move, you’re not alone. That’s where trading strategies come into play—especially ones that use powerful technical indicators like the MACD and Stochastic Oscillator. Today, we’re diving into the “Double-Cross Strategy,” which combines these two popular indicators to create a more reliable way to spot trading signals. Let’s explore how this strategy can be your go-to roadmap for navigating the ups and downs of the market.
What is MACD?
Understanding the Basics of MACD
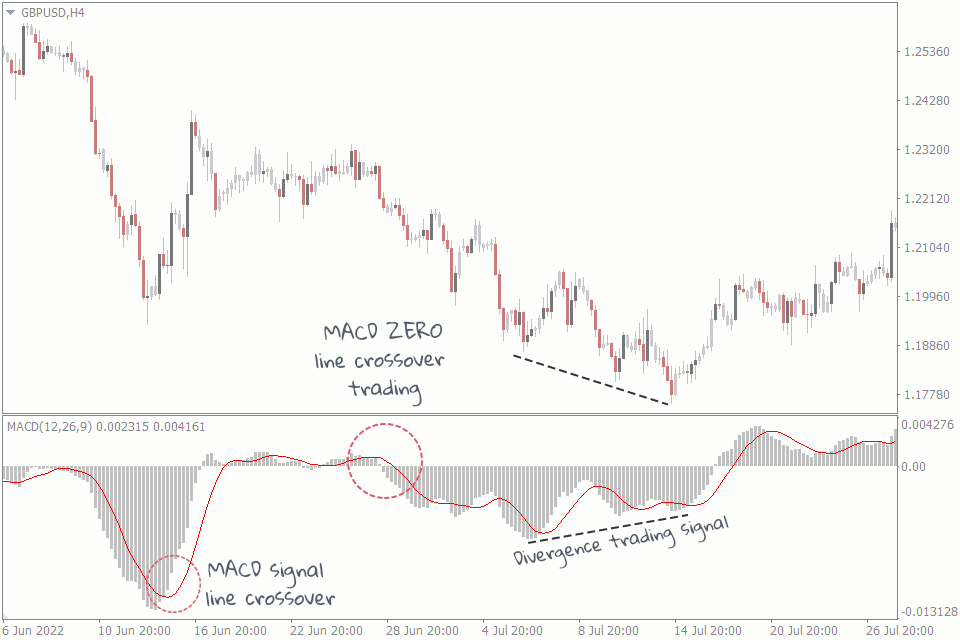
The MACD Indicator (Moving Average Convergence Divergence) is a favorite among traders for good reason. It’s made up of three main components: the MACD line, the signal line, and the histogram. The MACD line represents the difference between two exponential moving averages (EMAs), usually the 12-day and 26-day EMAs. The signal line, a 9-day EMA of the MACD line, serves as a trigger for buy or sell signals, while the histogram visually shows the gap between the MACD and signal lines.
How MACD Works
The MACD is all about crossovers and divergences. When the MACD line crosses above the signal line, it’s often seen as a buy signal, suggesting the start of an upward trend. On the flip side, when it crosses below, it signals a potential downturn. Divergences—where the price and MACD move in opposite directions—are another powerful clue that a trend reversal might be on the horizon.

Benefits of Using MACD in Trading
So, why do so many traders swear by MACD? It’s versatile and can be adapted to various markets, from stocks to forex. The MACD crossover strategy is easy to use, yet it’s effective in spotting shifts in momentum, making it a valuable tool in any trader’s arsenal.
What is the Stochastic Oscillator?
Breaking Down the Stochastic Oscillator
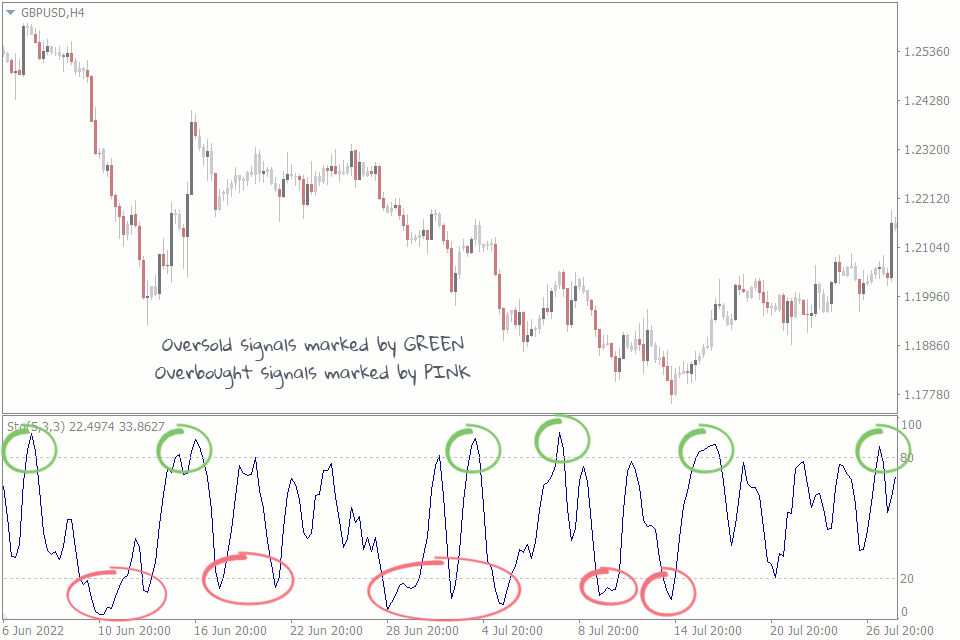
Think of the Stochastic Oscillator as a tool that measures the market’s pulse. It compares the current price level relative to its range over a specific period, usually 14 periods. The indicator consists of two lines: %K (the fast line) and %D (the slower line, which is a moving average of %K). These lines help identify overbought and oversold conditions, which can signal potential reversals.
How the Stochastic Oscillator Works
When the Stochastic lines are above 80, the market might be overbought—think of it like an overheated engine ready to cool down. Below 20, the market is oversold, suggesting it could be primed for a bounce back. Traders often look for crossovers between the %K and %D lines as a cue to buy or sell.

Benefits of Using the Stochastic Oscillator
The Stochastic Oscillator is particularly useful in ranging markets, helping traders identify when price movements are losing steam and might reverse. It’s simple to interpret, making it a great tool even for beginners who are just getting their feet wet in technical analysis.
The Double-Cross Strategy: Combining MACD and Stochastic
What is the Double-Cross Strategy?
The Double-Cross Strategy is like having two pairs of eyes on the market. It combines the signals from both the MACD and Stochastic Oscillator to create a more robust trading strategy. When both indicators align—such as when the MACD indicates a buy and the Stochastic shows the market is oversold—it provides a stronger confirmation, reducing the risk of acting on a false signal.
How to Set Up the Double-Cross Strategy
To set up this strategy, you’ll need a trading platform that supports both indicators, like TradingView or MetaTrader. Add the MACD Indicator with default settings (12, 26, 9) and the Stochastic Oscillator with settings of (14, 3, 3). Make sure your chart is set to a time frame that suits your trading style, whether it’s the 1-minute for quick scalps or the daily for longer positions.
How the Double-Cross Strategy Works
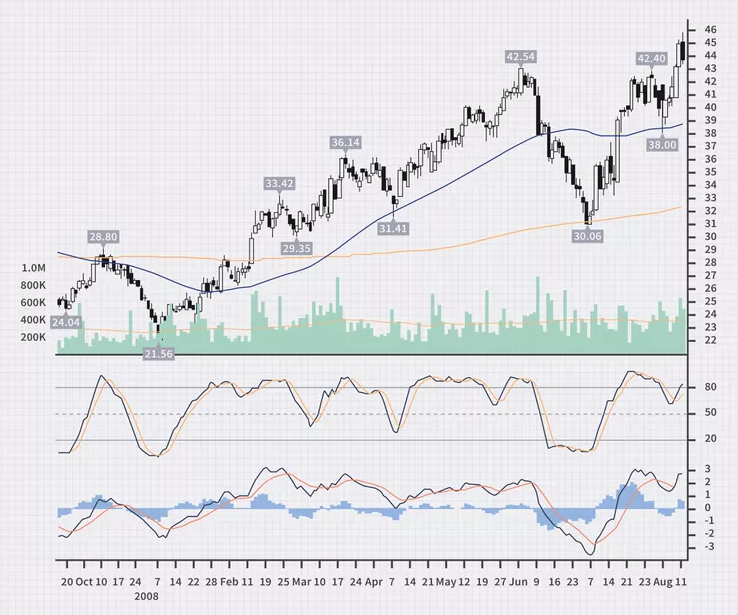
Here’s the play-by-play: wait for a MACD crossover that suggests a buy or sell signal. Then, check the Stochastic Oscillator—if it’s confirming with an overbought or oversold condition, that’s your double-cross signal! For instance, if the MACD crosses above the signal line while Stochastic is below 20, it’s a strong buy signal. This strategy helps to filter out weaker signals, giving you more confidence in your trades.
Why the Double-Cross Strategy Works
The Double-Cross Strategy works because it combines the best features of both indicators. MACD is excellent for identifying the trend and momentum, while Stochastic excels at spotting reversals. Together, they provide a more complete picture of the market, making it easier to time entries and exits.

Step-by-Step Guide to Implementing the Double-Cross Strategy
Step 1: Set Up Your Trading Platform
First, choose a trading platform that allows you to easily add and customize indicators. Platforms like MetaTrader, TradingView, and Thinkorswim are popular choices among traders.
Step 2: Adding MACD and Stochastic Indicators
Add the MACD Indicator and Stochastic Oscillator to your chart using the default settings. If you’re more experienced, feel free to tweak the settings to suit your specific needs or trading style.
Step 3: Identifying Trade Opportunities
Now, watch for the double-cross: a MACD crossover and a confirming signal from the Stochastic. This alignment is what you’re waiting for to pull the trigger on a trade.
Step 4: Placing Trades Based on Signals
When a buy or sell signal is confirmed by both indicators, enter the trade with a clear plan for your stop loss and take profit levels. Remember, it’s not just about getting in at the right time but also knowing when to get out.
Step 5: Managing Risks and Positions
Risk management is your safety net. Use stop-loss orders to protect your capital and consider your position size carefully. Never risk more than you’re willing to lose; aim to keep it within 1-2% of your total capital.
Pros and Cons of the Double-Cross Strategy
Advantages
The Double-Cross Strategy provides more reliable signals by combining the strengths of both indicators. It’s adaptable to different time frames and markets, making it suitable for a wide range of trading styles. Plus, it adds an extra layer of confirmation that can boost your confidence in taking trades.
Disadvantages
However, no strategy is perfect. The Double-Cross can sometimes lead to missed opportunities, especially in fast-moving markets where the signals lag. It can also give mixed signals in sideways markets, so it’s best used in trending conditions. Always test the strategy in a demo account to get comfortable before trading with real money.
Tips for Maximizing Success with the Double-Cross Strategy
Tips and Tricks for Traders
Start by using a demo account to practice. Familiarize yourself with how the indicators interact and take note of the best conditions for the strategy. Adjust the settings of the MACD and Stochastic based on the market you’re trading. A trading journal can also be a valuable tool—tracking your trades helps you learn and refine your approach over time.
Common Mistakes to Avoid
One common mistake is over-relying on the indicators without considering market context. Remember, indicators are tools that help guide your decisions, not guarantees. Avoid trading solely based on these signals during major news events or in extremely volatile conditions. Lastly, be patient—wait for clear signals from both indicators to align before jumping into a trade.
Conclusion
The Double-Cross Strategy is a powerful way to combine the MACD and Stochastic Oscillator, offering traders a more comprehensive view of the market. By waiting for both indicators to confirm buy or sell signals, you can reduce the noise and make more informed trading decisions. It’s not without its challenges, but with practice, discipline, and good risk management, it can be a game-changer in your trading journey. So why not give it a try? The next time you’re setting up your charts, look for that double-cross and see if it leads you to a successful trade!
FAQs
- Can I use the Double-Cross Strategy in any market?
Yes, you can use the Double-Cross Strategy across various markets, including stocks, forex, and commodities. However, it tends to perform best in trending markets rather than sideways or choppy conditions.
- What time frames work best for the Double-Cross Strategy?
This strategy is versatile and works on different time frames, from 1-minute charts for scalping to daily charts for swing trading. Typically, longer time frames provide more reliable signals, but it’s all about finding what works best for your trading style.
- Is the Double-Cross Strategy suitable for beginners?
Absolutely! The Double-Cross Strategy is easy to understand and implement, making it a great starting point for beginners interested in learning about trading strategies and technical analysis.
- How do I customize the MACD and Stochastic settings?
Most trading platforms allow you to customize the settings of your indicators. For MACD, you can adjust the periods of the moving averages (e.g., 12, 26, 9 are standard). For Stochastic, tweak the %K, %D, and smoothing values based on your trading needs and market conditions.
- What are the common challenges when using the Double-Cross Strategy?
Challenges include dealing with conflicting signals during sideways markets and the patience required to wait for both indicators to align. Managing these challenges involves sticking to your plan and employing good risk management practices.


