RSI and Moving Average Crossover Trading Strategy

Navigating the world of trading can feel like trying to solve a complex puzzle, but with the right strategies, like the RSI and Moving Average Crossover, you can start piecing together a path to success. In this guide, we’ll explore how to effectively use RSI and Moving Averages together, creating a robust trading strategy that helps you identify buy and sell signals with confidence. Whether you’re a beginner or an experienced trader, this strategy can be your new go-to in the trading toolkit.
Introduction to RSI and Moving Average Crossovers
Trading strategies are the backbone of any trader’s success, and the combination of the RSI Indicator with Moving Average Crossovers is one of the most reliable approaches out there. Let’s start by breaking down these components and why they work so well together.
What is RSI?
The RSI Indicator (Relative Strength Index) is a momentum oscillator that helps traders evaluate the speed and change of price movements. It operates on a scale from 0 to 100, where readings above 70 typically suggest an asset is overbought, and readings below 30 indicate it might be oversold.
Understanding the RSI Indicator
RSI is calculated based on average price gains and losses over a set period, usually 14 periods. It’s widely used in technical analysis for beginners and pros alike to identify potential reversal points and gauge market momentum.
How RSI Helps in Trading
Think of RSI as your personal trading compass. It not only highlights overbought and oversold conditions but also provides insights into price momentum. For instance, if the price keeps rising but the RSI starts to fall, this divergence could be a sign of a looming reversal—a crucial cue for your trading strategy.
What is a Moving Average Crossover?
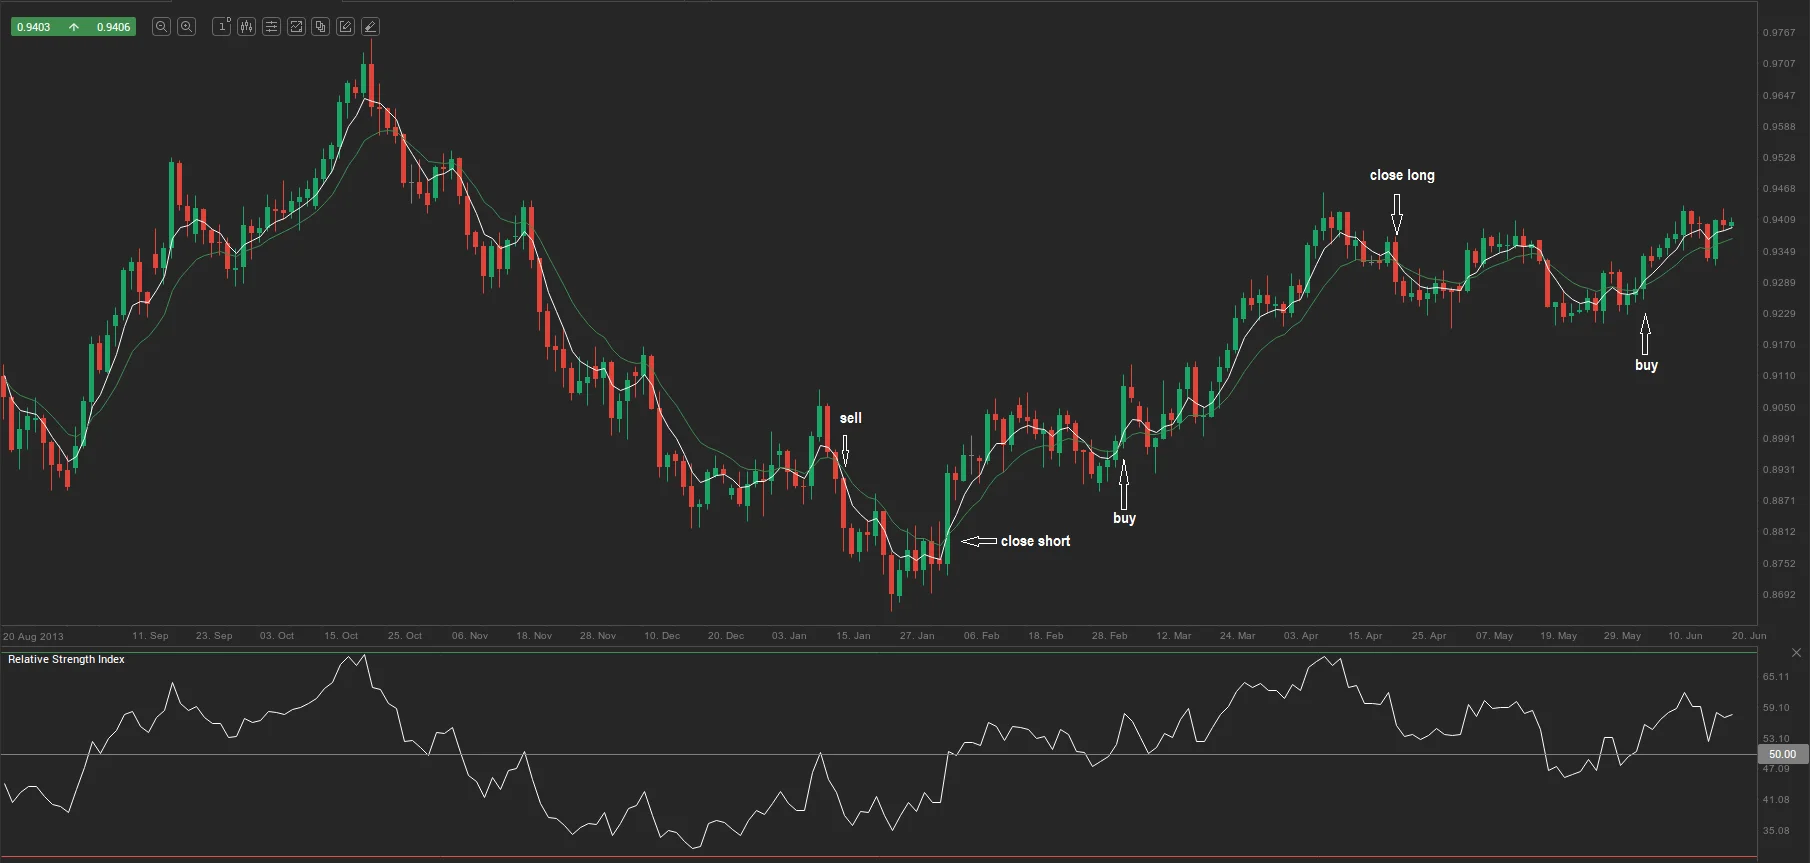
A Moving Average Crossover occurs when a short-term moving average crosses over a long-term moving average, signaling a potential change in the market trend. This method helps traders identify buy and sell signals based on historical price data.
Types of Moving Averages
There are primarily two types: Simple Moving Average (SMA) and Exponential Moving Average (EMA). The SMA gives equal weight to all price points over a specified period, while the EMA assigns more weight to recent prices, making it more responsive to new information.
How Moving Averages Signal Buy and Sell
A common trading strategy involves the 50-day and 200-day moving averages. A Golden Cross happens when the short-term moving average (50-day) crosses above the long-term moving average (200-day), indicating a buy signal. Conversely, a Death Cross occurs when the short-term average crosses below the long-term average, signaling a sell.
Why Combine RSI with Moving Average Crossovers?
Combining RSI with Moving Average Crossovers is like having a trading GPS; it not only tells you where you’re going but also highlights the best routes to take. Using these indicators together can filter out false signals and provide more reliable entries and exits.
The Synergy Between RSI and Moving Averages
RSI measures the momentum of price changes, while moving averages smooth out price data to identify trends. When you merge these tools, you get a strategy that’s capable of catching trends early and exiting before reversals, optimizing your trading performance.
Benefits of Combining These Indicators
Using both RSI and moving averages helps reduce the risk of false signals. The RSI confirms the strength of a trend or a potential reversal, while the crossover points of moving averages suggest optimal buy or sell points. This dual confirmation can enhance your trading decisions.
Setting Up the RSI and Moving Average Crossover Strategy
Setting up this trading strategy involves picking the right timeframes, choosing suitable RSI parameters, and selecting the most effective moving averages for your needs.
Choosing the Right Timeframe
Your chosen timeframe plays a critical role in how signals are generated. Day traders often use shorter timeframes like 15-minute or 1-hour charts, whereas swing traders might prefer daily charts for a broader view of market trends.
Selecting RSI Parameters
The default setting for RSI is 14 periods, but you can adjust it based on your trading style. For instance, a 7-period RSI is more sensitive and reacts faster to price changes, while a 21-period RSI smooths out short-term fluctuations.
Choosing the Moving Averages
Choosing the right moving averages is essential for the effectiveness of this strategy. A common combination is the 9-day EMA and the 21-day EMA. Shorter averages capture quicker movements, while longer averages help in identifying sustained trends.
Short-Term vs Long-Term Averages
Short-term averages like the 9-day EMA respond quickly to price changes, making them useful for identifying rapid shifts in trends. Long-term averages, such as the 21-day EMA, filter out noise and provide a clearer picture of the overall trend direction.
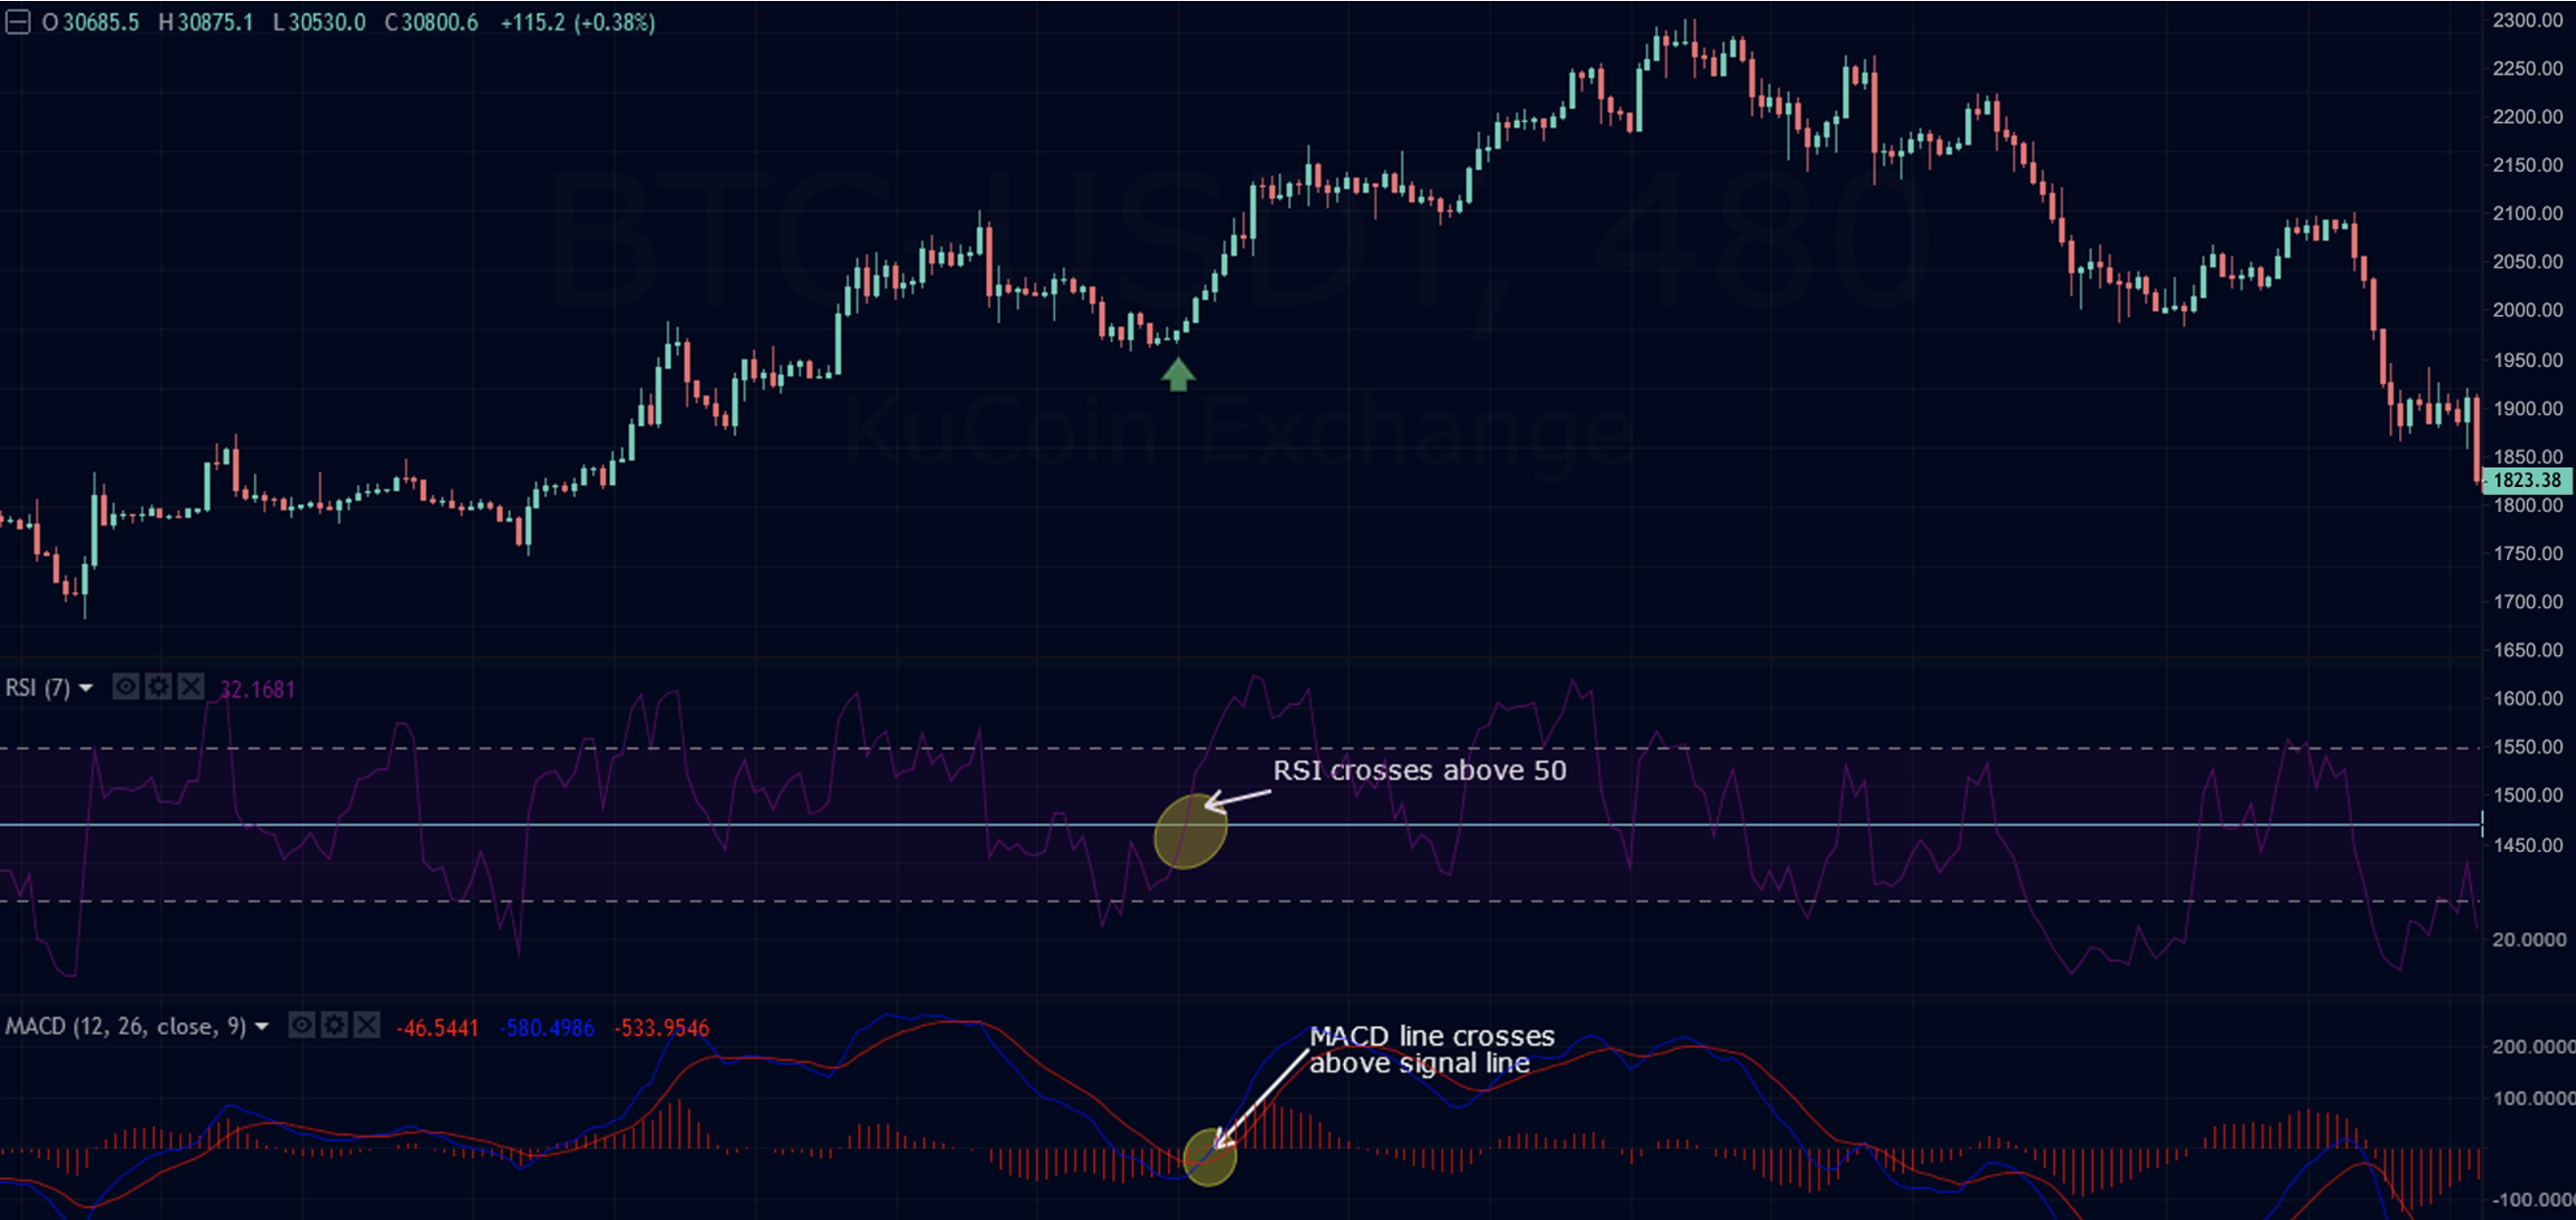
Below we provide an example of a long trade and a short trade, based on this strategy.

Step-by-Step Guide to Implementing the Strategy
Here’s a simple guide to get you started with the RSI and Moving Average Crossover Trading Strategy.
Step 1: Setting Up Your Chart
First, open your trading platform and add the RSI indicator and two moving averages. Configure the settings to suit your chosen timeframes and trading goals.
Step 2: Identifying Buy Signals
A buy signal is generated when the RSI moves above 30, indicating that the asset is no longer in oversold territory, and the short-term moving average crosses above the long-term moving average. This alignment can give you a strong cue to go long.

Double Confirmation Buy-Signal Example on the Ethereum Price Chart
Step 3: Identifying Sell Signals
Conversely, a sell signal occurs when the RSI drops below 70, suggesting that the asset is exiting overbought levels, and the short-term moving average crosses below the long-term moving average. This signal can help you time your exits effectively.

Double Confirmation Sell-Signal Example on the Bitcoin Price Chart
Practical Example of RSI and Moving Average Crossover
Let’s take a look at a real-world example to see how this strategy plays out.
A Real-World Trading Example
Imagine trading a popular tech stock on a 1-hour chart. The RSI dips below 30, indicating oversold conditions. Shortly after, the 9-day EMA crosses above the 21-day EMA. This combination of signals prompts a buy. As the stock price climbs, you watch the RSI approach 70, ready to lock in profits before a reversal.
Analyzing the Signals
In this scenario, the RSI provided an early warning of a potential trend change, and the moving average crossover confirmed it. By waiting for both indicators to align, you can make more informed trading decisions and reduce the likelihood of jumping in too early or late.
Pros and Cons of the RSI and Moving Average Crossover Strategy
As with any trading strategy, it’s important to understand both its strengths and limitations.
Advantages of the Strategy
This approach provides clear, straightforward signals and can be used across various markets, including stocks, forex, commodities, and cryptocurrencies. It’s adaptable, making it suitable for both novice traders and seasoned professionals.
Potential Drawbacks and How to Mitigate Them
The strategy isn’t foolproof and can occasionally produce false signals, particularly in sideways or choppy markets. To reduce these risks, consider combining this strategy with other tools like volume analysis or key support and resistance levels.
Tips for Optimizing Your Trading Strategy
To get the most out of this strategy, keep these optimization tips in mind.
Avoiding Common Mistakes
One of the biggest mistakes traders make is relying too heavily on one indicator. Always remember that the best trading decisions come from a well-rounded approach. Consider incorporating additional indicators to confirm your entries and exits.
Fine-Tuning for Different Market Conditions
Markets are constantly changing, and a strategy that works well in trending markets might struggle in range-bound conditions. Be prepared to tweak your parameters or sit out during periods of high uncertainty.
Backtesting and Forward Testing Your Strategy
Before putting real money on the line, it’s critical to test your strategy.
Importance of Testing Before Live Trading
Backtesting allows you to apply your strategy to historical data, giving you insights into its performance without risking actual funds. Forward testing in a demo account helps validate your approach in real-time conditions.
Tools for Backtesting and Forward Testing
Many platforms, like MetaTrader and TradingView, offer built-in tools for backtesting and forward testing. Use these to refine your strategy, adjust settings, and optimize your approach across various market conditions.
Conclusion
Combining RSI with Moving Average Crossovers can create a versatile and reliable trading strategy that provides clear signals for buy and sell decisions. By understanding and implementing this approach, you’ll be better equipped to navigate the markets with confidence and precision. Remember, the key isn’t just in the strategy itself but also in how well you adapt it to your unique trading style and the ever-changing market landscape.
FAQs
- What is the best timeframe for this strategy?
The ideal timeframe depends on your trading style. Day traders may prefer 15-minute or 1-hour charts, while swing traders often opt for daily charts to capture longer-term trends. - Can I use this strategy on any asset?
Yes, the RSI and Moving Average Crossover Strategy is highly versatile and can be applied to stocks, forex, commodities, and even cryptocurrencies. Just adjust your parameters to suit the asset’s volatility. - How do I know when to adjust my parameters?
Regularly review your trades and results. If you notice inconsistencies or if the strategy isn’t performing as expected, consider tweaking the RSI periods or the moving average lengths to better fit current market conditions. - Is this strategy suitable for beginners?
Definitely! This strategy is straightforward and provides clear entry and exit points, making it a great choice for beginners. Just make sure to practice in a demo account before trading with real money. - What are the risks involved in this strategy?
As with any trading strategy, there’s always a risk of false signals and market reversals. Using stop-loss orders and risk management techniques can help protect your capital from significant losses.


