Bollinger Bands & RSI Combination Strategy

Introduction to Bollinger Bands and RSI Combination Strategy
Looking to enhance your trading skills? The Bollinger Bands and RSI strategy could be just what you need to boost your market insights. By combining the strengths of Bollinger Bands and RSI (Relative Strength Index), this strategy offers a more refined approach to identifying potential buy and sell signals. Whether you’re diving into stock trading strategies, forex, or even day trading, this guide will walk you through everything you need to know about using these indicators together effectively.
Understanding Bollinger Bands in Trading
What Are Bollinger Bands?
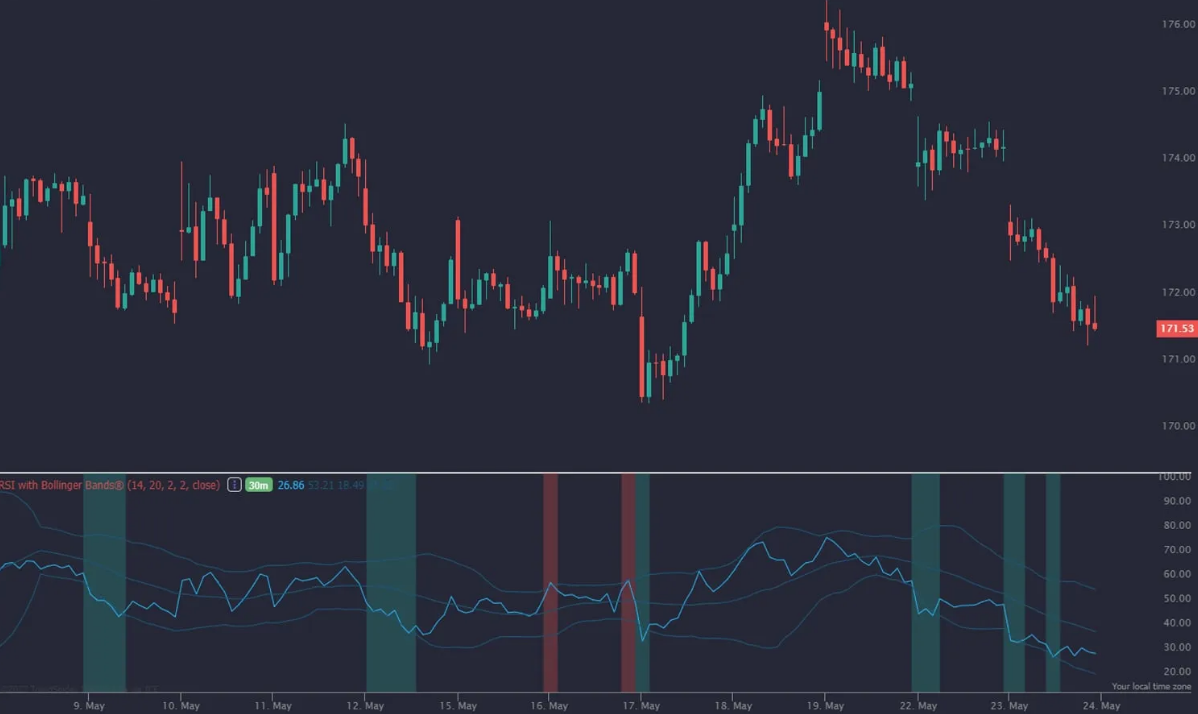
Bollinger Bands, created by John Bollinger, are a popular technical analysis tool that measures market volatility. They consist of three lines: a middle simple moving average (usually 20 periods), and an upper and lower band that are set two standard deviations away from the SMA. These bands expand and contract based on the asset’s volatility, helping traders spot potential overbought or oversold conditions, which is crucial for any Bollinger Bands trading strategy.
How Bollinger Bands Work in Trading
When prices touch the upper band, the market is considered overbought, and when they hit the lower band, it’s seen as oversold. This behavior provides traders with valuable information on when to enter or exit trades, making Bollinger Bands an essential part of various stock trading strategies.
Key Components of Bollinger Bands
- Middle Band: A simple moving average, typically set at 20 periods.
- Upper Band: Two standard deviations above the middle band.
- Lower Band: Two standard deviations below the middle band.
These components allow Bollinger Bands to adjust dynamically to changing market conditions, helping traders make more informed decisions.
Introduction to RSI (Relative Strength Index) in Trading
What Is RSI?
The Relative Strength Index (RSI) is a momentum oscillator that measures the speed and change of price movements. It ranges from 0 to 100 and helps identify overbought or oversold conditions. An RSI above 70 suggests an overbought market, while an RSI below 30 indicates it’s oversold. RSI is a core component in many successful trading strategies, particularly for those seeking to refine entry and exit points.
How RSI Works in Trading
RSI helps traders gauge market momentum. For example, an RSI above 70 may signal that the asset is overvalued and could soon see a reversal, whereas an RSI below 30 suggests that the asset may be undervalued, offering a potential buying opportunity.
Key Components of RSI
- Overbought Level (70): Indicates the market may be overvalued.
- Oversold Level (30): Indicates the market may be undervalued.
- Midline (50): Can act as support or resistance, providing additional context in trending markets.

Why Combine Bollinger Bands and RSI in Your Trading Strategy?
The Strengths of Using Both Indicators
When used separately, Bollinger Bands and RSI each offer unique insights into market conditions. However, combining them into a Bollinger Bands RSI strategy allows for more accurate trade signals. Bollinger Bands help visualize market volatility, while RSI identifies momentum shifts, making their combination a powerful tool for any trader.
How the Combination Enhances Trading Decisions
The Bollinger Bands and RSI combination strategy enables traders to filter out false signals and focus on high-probability trades. For example, if the price touches the lower Bollinger Band while the RSI indicates an oversold condition, it may be a strong signal to buy. This dual confirmation helps refine your trading decisions, reducing the likelihood of entering a trade based on a single, potentially misleading indicator.
Setting Up Bollinger Bands and RSI on Your Trading Chart
Step-by-Step Guide to Setting Up Bollinger Bands
- Open your preferred trading platform and select your asset.
- Add Bollinger Bands to your chart.
- Set the period to 20 and the standard deviation to 2, which are the default settings.
- Customize the appearance if needed for better visibility.
Configuring Bollinger Bands Settings
Adjust the settings based on your trading style. Shorter periods might suit day trading with Bollinger Bands and RSI, while longer periods could work better for swing trading strategies.
Step-by-Step Guide to Setting Up RSI
- On the same chart, add the RSI indicator.
- Set the period to 14, the standard setting recommended by the creator.
- Customize the overbought and oversold levels if desired, though the default 70/30 is generally effective.
Configuring RSI Settings
RSI’s default settings are usually sufficient, but you can tweak them to better fit different market conditions or personal preferences. For example, setting levels to 60/40 can provide a more conservative approach, especially in trending markets.
The Bollinger Bands and RSI Combination Strategy in Action
Key Signals to Look For
Identifying Overbought and Oversold Conditions with Bollinger Bands and RSI
The most reliable signals occur when both Bollinger Bands and RSI show overbought or oversold conditions simultaneously. For example, when the price hits the lower Bollinger Band and the RSI is below 30, it’s a strong indication that the asset is oversold and a potential buy signal.
Spotting Divergences with RSI and Bollinger Bands
Divergences between price action and RSI readings can also signal potential reversals. For instance, if the price makes higher highs while RSI makes lower highs, it may indicate that the upward momentum is weakening, suggesting a potential trend reversal.
Step-by-Step Execution of the Bollinger Bands RSI Combination Strategy
Entry Points
- Look for the price to touch or break below the lower Bollinger Band.
- Confirm with RSI that the asset is oversold (RSI below 30).
- Consider entering a buy position once the price begins to move back above the lower band.
Exit Points
- Monitor the upper Bollinger Band as a potential target.
- Use RSI readings approaching the overbought zone (above 70) as a signal to consider exiting the trade.
- Always employ a stop-loss below recent price lows to manage risk effectively.

Pros and Cons of the Bollinger Bands RSI Combination Strategy
Benefits of Using the Bollinger Bands and RSI Strategy
- Improved Accuracy: By using both indicators, you can reduce the likelihood of false signals and make more confident trading decisions.
- Versatility Across Assets: This strategy can be applied to forex, stocks, and even crypto trading, making it a versatile tool in any trader’s arsenal.
- User-Friendly: Even beginners can effectively use this strategy with a basic understanding of technical analysis.
Potential Drawbacks and How to Mitigate Them
- Lagging Indicators: Both Bollinger Bands and RSI are lagging indicators, meaning they reflect past price action rather than predict future moves.
- False Signals: While reduced, false signals can still occur, especially in choppy or highly volatile markets.
To mitigate these drawbacks, consider adding other forms of analysis, such as chart patterns or volume analysis, and always practice solid risk management.
Tips for Success with the Bollinger Bands and RSI Strategy
Common Mistakes to Avoid
- Ignoring Market Context: Not all market conditions suit this strategy. It tends to be less effective in strongly trending or highly volatile markets.
- Over-reliance on Indicators: Don’t rely solely on Bollinger Bands and RSI. Use them as part of a broader analysis that includes other market factors.
Best Practices for Effective Trading
- Backtest Your Strategy: Before trading live, test the Bollinger Bands RSI strategy on historical data to see how it performs in different market conditions.
- Stick to Your Plan: Maintain discipline by following your trading plan and avoiding impulsive decisions based on market noise.
- Stay Updated: Continuously refine your strategy by keeping up with market trends and incorporating new insights.
Conclusion
The Bollinger Bands and RSI combination strategy is a powerful tool for traders looking to improve their technical analysis skills. By blending volatility insights from Bollinger Bands with momentum signals from RSI, this strategy helps traders make more informed decisions, whether you’re engaging in forex, stock, or day trading. Remember, success in trading comes down to preparation, discipline, and continuous learning. So, set up your charts, apply these insights, and start trading smarter today!
FAQ
- Can I use the Bollinger Bands and RSI strategy for day trading?
Yes, the Bollinger Bands RSI strategy works well for day trading, especially on shorter time frames like 5-minute or 15-minute charts. Be sure to test the strategy in your specific time frame before going live. - What time frames work best with the Bollinger Bands and RSI combination?
This strategy is versatile and can be applied across various time frames. However, it’s commonly used on 1-hour, 4-hour, and daily charts for optimal results. Test different settings to find what works best for you. - How can I adjust the Bollinger Bands and RSI settings for different market conditions?
In more volatile markets, you might increase the standard deviation for Bollinger Bands or adjust RSI levels to 60/40 to reduce noise and improve signal accuracy. - Are there risks associated with the Bollinger Bands RSI strategy?
Like any trading strategy, there are risks, including false signals and lagging indicator issues. Always use risk management techniques like stop-loss orders to protect your capital.


