Bollinger Bands: What They Are and How to Use Them

So, you’ve probably heard the term “Bollinger Bands” tossed around if you’ve dipped your toes into technical analysis. They’re like a secret weapon for traders, giving you a read on market volatility and helping you make smarter trading moves. But what exactly are these Bollinger Bands, and how can you actually use them? Let’s break it down together and cover the basics you need to know.
What Are Bollinger Bands?
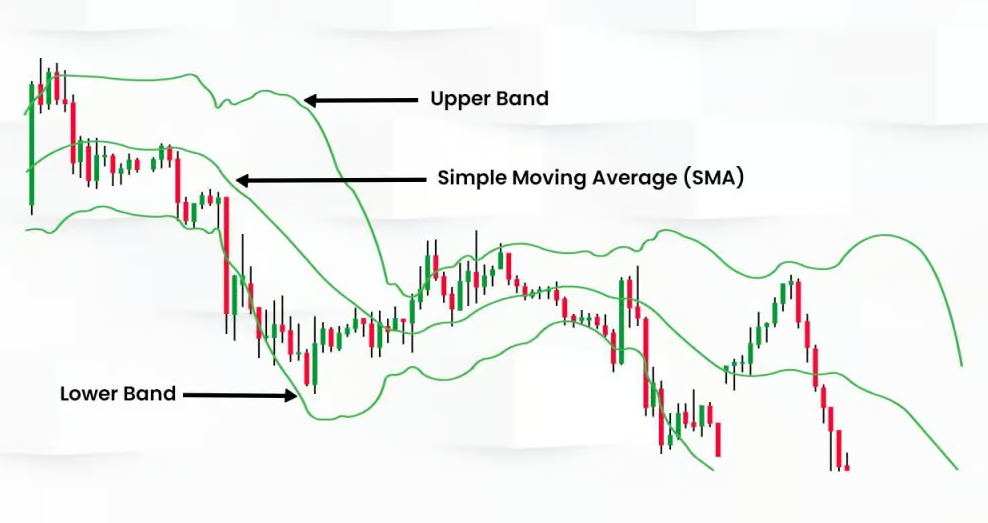
Bollinger Bands are a type of statistical chart characterizing the prices and volatility of a financial instrument over time. Developed by financial analyst John Bollinger in the early 1980s, these bands consist of three lines: a simple moving average (SMA) and two standard deviation lines – one above and one below the SMA.

Importance of Bollinger Bands in Technical Analysis
Bollinger Bands are widely used in technical analysis because they help traders understand how prices are moving relative to their historical norms. By observing the bands, traders can identify whether an asset is overbought or oversold, as well as potential market reversals.
History and Origin of Bollinger Bands
Who Invented Bollinger Bands?
The brainchild of John Bollinger, a prominent technical analyst, Bollinger Bands were created as a way to systematically gauge market volatility. Bollinger sought a more adaptive tool than the traditional moving average and created these bands to reflect changes in volatility.
The Evolution of Bollinger Bands in Financial Markets
Since their inception, Bollinger Bands have evolved to become a staple in the toolkit of traders across the globe. From stock markets to forex trading, these bands have been adapted to analyze different asset classes and have stood the test of time.
Understanding the Components of Bollinger Bands
The Middle Band: Simple Moving Average (SMA)
At the heart of Bollinger Bands is the simple moving average (SMA), typically set to 20 periods. The SMA represents the average price over a specific time frame and serves as the middle line of the Bollinger Bands.
The Upper and Lower Bands: Standard Deviations Explained
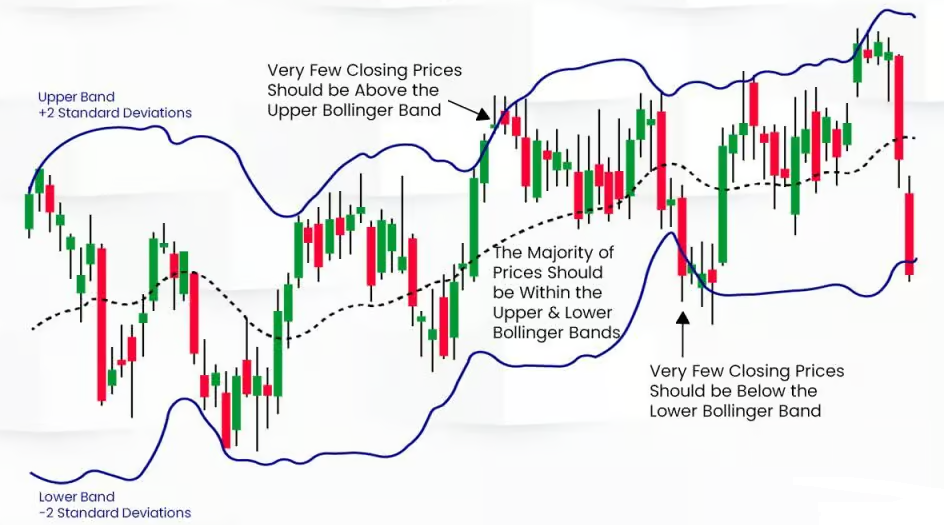
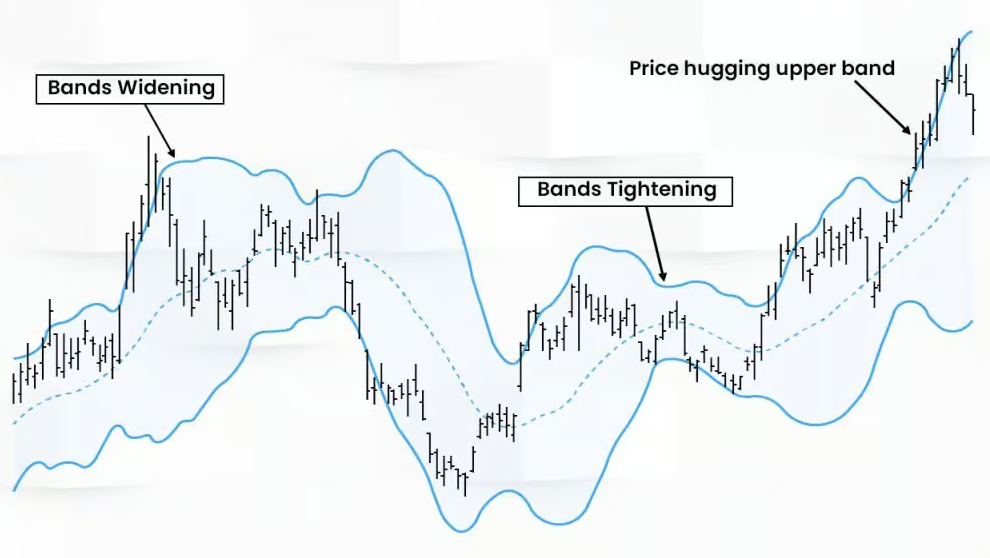
The upper and lower bands are placed two standard deviations above and below the SMA. These bands expand and contract based on market volatility – when the market is volatile, the bands widen; when the market is stable, they narrow.
How the Bands Expand and Contract with Market Volatility
The dynamic nature of Bollinger Bands makes them unique. They adapt to market conditions, providing traders with real-time insights into volatility. When the bands squeeze tightly together, it often indicates a period of low volatility, which might precede a significant price move.
How Bollinger Bands Work
The Basic Concept: Price Envelopes
Think of Bollinger Bands as a price envelope, where prices are expected to stay within the upper and lower bands most of the time. When prices break out of these bands, it could signal a strong trend or a reversal.
Interpretation of Bollinger Bands in Market Trends
The key to using Bollinger Bands effectively lies in understanding how they reflect market trends. A price consistently hugging the upper band suggests a strong uptrend, while a price that touches the lower band might indicate a downtrend.
Take a look at the image below, and you’ll notice how the price behaves when it hits the Bollinger Bands, highlighted by the black box. The price tends to interact with the Simple Moving Average (SMA) right in the middle and often bounces off the upper and lower bands. This is a classic example of how these bands can signal potential changes in price direction.

Key Strategies Using Bollinger Bands
The Squeeze Strategy
One of the most popular strategies is the Bollinger Band Squeeze. This occurs when the bands tighten closely around the SMA, signaling low volatility. Traders watch for a breakout in either direction, as the squeeze often precedes a big move.
Bollinger Band Bounce Strategy
Another strategy is the Bollinger Band Bounce. Since prices tend to return to the middle band after hitting the upper or lower bands, traders use this bounce effect to enter or exit trades, aiming to capitalize on these reversals.
Bollinger Bands with Other Indicators
Bollinger Bands work exceptionally well when combined with other indicators, such as the Relative Strength Index (RSI) or Moving Average Convergence Divergence (MACD). These combinations can provide more robust signals and help confirm market trends.
Trading Signals Generated by Bollinger Bands
Identifying Breakouts
When prices break above or below the bands, it can be a signal of a potential breakout. However, it’s crucial to confirm this signal with other indicators to avoid false breakouts.
Recognizing Overbought and Oversold Conditions
When the price is near the upper band, it might be considered overbought, and when it’s near the lower band, it might be oversold. These conditions can indicate potential reversal points.
Using Bollinger Bands to Confirm Trends
Bollinger Bands are not just about spotting potential reversals; they can also confirm trends. A price consistently staying within the upper or lower band might suggest a strong ongoing trend, providing traders with the confidence to hold onto their positions.
Bollinger Bands in Different Market Conditions
Bollinger Bands in Bullish Markets
In bullish markets, prices often ride the upper band. Traders can use this behavior to identify opportunities to stay long on an asset, riding the trend until the price breaks downwards.
Bollinger Bands in Bearish Markets
Conversely, in bearish markets, prices might consistently hit the lower band. This could be a signal for traders to remain short, anticipating further declines.
Bollinger Bands in Sideways or Range-Bound Markets
In a range-bound market, Bollinger Bands can be used to identify buying and selling opportunities. Prices tend to oscillate between the upper and lower bands, providing clear entry and exit points for trades.
Common Misconceptions About Bollinger Bands
Misinterpreting the Bands as Constant Signals
One common misconception is that Bollinger Bands always give clear buy or sell signals. However, they should be used in conjunction with other indicators for more reliable signals.
Over-reliance on Bollinger Bands Without Other Indicators
Relying solely on Bollinger Bands can lead to missed opportunities or false signals. It’s essential to combine them with other technical analysis tools to build a more comprehensive trading strategy.
Advanced Bollinger Band Techniques
Double Bollinger Bands
A more advanced technique involves using double Bollinger Bands, where traders plot two sets of bands – one at 1 standard deviation and another at 2 standard deviations. This method can help identify stronger trends and potential reversal points with greater precision.
Bollinger Band Width and Its Implications
The width of the Bollinger Bands can be an indicator of market volatility. Narrow bands suggest low volatility, which might lead to a breakout, while wide bands indicate high volatility.
Combining Bollinger Bands with Volume Analysis
Volume analysis can enhance the effectiveness of Bollinger Bands. For example, a breakout accompanied by high volume is more likely to be significant than one with low volume, providing traders with additional confirmation.
Practical Applications of Bollinger Bands
Bollinger Bands in Day Trading
Day traders can use Bollinger Bands to make quick decisions on intraday price movements. The bands help identify short-term trends and potential reversal points, making them a valuable tool for scalping and other fast-paced trading strategies.
Using Bollinger Bands for Long-Term Investments
Long-term investors can also benefit from Bollinger Bands by identifying overbought or oversold conditions in long-term charts. This can help in making decisions about entering or exiting positions based on broader market trends.
Case Studies: Real-Life Examples of Bollinger Bands in Action
Several real-life examples demonstrate the effectiveness of Bollinger Bands. For instance, during the 2008 financial crisis, Bollinger Bands helped traders spot the extreme volatility and make informed decisions amidst the market chaos.
Limitations of Bollinger Bands
The Lagging Nature of Bollinger Bands
Like many indicators, Bollinger Bands are based on past price data, which means they can lag behind current market conditions. This lag can result in delayed signals, especially in fast-moving markets.
The Risk of False Signals
Bollinger Bands can sometimes generate false signals, particularly in choppy markets. Traders need to be cautious and use additional indicators to confirm the validity of a signal.
How to Mitigate the Drawbacks of Bollinger Bands
To mitigate the limitations of Bollinger Bands, it’s essential to use them in conjunction with other technical tools, maintain a flexible trading strategy, and always be aware of the broader market context.
Tools and Software for Bollinger Bands Analysis
Popular Platforms that Feature Bollinger Bands
Several trading platforms, such as MetaTrader, TradingView, and Thinkorswim, offer Bollinger Bands as part of their technical analysis tools. These platforms allow traders to customize the bands and integrate them with other indicators for comprehensive analysis.
Customizing Bollinger Bands in Trading Software
Most trading software allows you to adjust the parameters of Bollinger Bands, such as the period of the SMA and the number of standard deviations. Customization enables traders to tailor the bands to their specific trading style and market conditions.
Tips for Beginners Using Bollinger Bands
Starting Simple: The Basics to Keep in Mind
For beginners, it’s best to start with the default settings of Bollinger Bands (20-period SMA and 2 standard deviations). As you become more familiar with how they work, you can experiment with different settings to see what works best for your trading style.
Common Pitfalls and How to Avoid Them
A common pitfall is overtrading based on Bollinger Band signals. To avoid this, ensure you have a clear strategy and combine Bollinger Bands with other indicators to filter out noise and focus on high-probability trades.
What is the difference between Bollinger Bands and Moving Averages?
While Bollinger Bands and Moving Averages are both crucial in technical analysis, they each play distinct roles. A Moving Average, particularly the Simple Moving Average (SMA), is designed to smooth out price data, helping traders identify the underlying trend of an asset over a given period. By providing a single line that represents the average price over time, the SMA makes it easier to spot whether the market is trending upward, downward, or sideways.
In contrast, Bollinger Bands expand on this concept by adding two additional lines—one above and one below the SMA—based on standard deviations. These bands create a flexible range that adjusts to market volatility, offering traders insights into both the trend and how much the price is likely to deviate from that trend. Essentially, while a Moving Average is excellent for seeing the direction of the trend, Bollinger Bands provide a clearer picture of potential price movements and volatility, making them a more comprehensive tool for analyzing market conditions.

Conclusion
Bollinger Bands are an incredibly versatile and powerful tool in the world of technical analysis. They offer valuable insights into market volatility, trends, and potential reversal points. However, like any tool, they are most effective when used as part of a broader trading strategy. By understanding how to interpret and apply Bollinger Bands, traders can enhance their market analysis and make more informed trading decisions.
FAQs
- How are Bollinger Bands calculated? Bollinger Bands are calculated using a simple moving average (SMA) and adding/subtracting standard deviations to create the upper and lower bands.
- Can Bollinger Bands predict market direction? Bollinger Bands do not predict market direction but help identify potential reversals and overbought/oversold conditions.
- How reliable are Bollinger Bands? Bollinger Bands are reliable when used with other indicators. They should not be relied upon in isolation.
- What are the best time frames to use Bollinger Bands? Bollinger Bands can be used on various time frames, but they are commonly used on daily charts for swing trading and intraday charts for day trading.
- How do I set up Bollinger Bands on my trading platform? Most trading platforms have Bollinger Bands as a built-in indicator. You can typically find them in the indicators section and customize the settings according to your preference.


