Fibonacci Retracements and Extensions

In the world of trading, it’s like trying to find your way through a dense forest without a map. But what if I told you there’s a hidden tool that can help you navigate the market’s ups and downs? Meet Fibonacci Retracement and Extensions, your compass in the wild world of trading. These tools are not just reserved for the pros; they’re accessible to anyone willing to learn the ropes. So, let’s dive into the fascinating world of Fibonacci, where math meets market trends!
What Are Fibonacci Retracement and Extensions?
Fibonacci Retracement and Extensions are powerful tools that traders use to predict potential support and resistance levels in the market. They are based on the Fibonacci sequence—a series of numbers where each number is the sum of the two preceding ones, starting from zero and one. But don’t worry, you don’t need to be a math genius to use these tools. They’re all about finding those sweet spots in market price movements where things might change direction.
Why Fibonacci Tools Are Popular in Trading
Traders love Fibonacci because it provides a systematic way to anticipate market movements. It’s like having a secret formula that helps you gauge where the market might reverse or where a trend might continue. Whether you’re a day trader or someone who’s in it for the long haul, Fibonacci can help you make more informed decisions.
Understanding the Basics
The Origin of Fibonacci Numbers
Let’s take a quick trip back to the 13th century when a mathematician named Leonardo Fibonacci introduced the Fibonacci sequence to the Western world through his book “Liber Abaci.” These numbers aren’t just random; they appear in nature everywhere—from the arrangement of leaves on a stem to the pattern of a seashell. In trading, these numbers help identify key levels of retracement and extension in price movements.
How Fibonacci Applies to Financial Markets
In financial markets, Fibonacci levels are used to predict where a price might retrace before continuing in the original direction. Think of it like taking two steps forward, one step back—these levels help us understand where that “step back” might happen. It’s a bit like predicting the rhythm of the market dance.
Fibonacci Retracement Levels
What Are Fibonacci Retracement Levels?
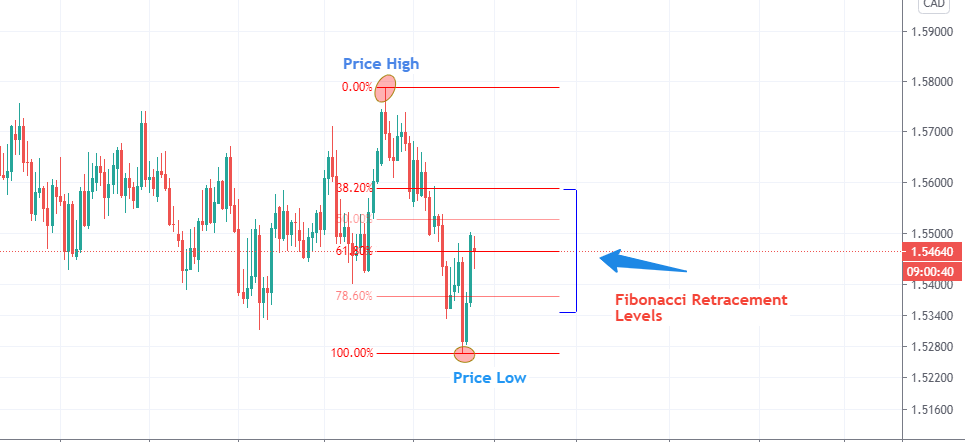
Fibonacci Retracement Levels are horizontal lines that indicate where support and resistance are likely to occur. They are derived from the Fibonacci sequence and include levels such as 23.6%, 38.2%, 50%, 61.8%, and sometimes 76.4%. Traders use these levels to find potential reversal points in a market trend.

How to Calculate Fibonacci Retracement Levels
You don’t have to calculate these levels manually—most trading platforms have built-in Fibonacci tools. However, it’s good to know how they work. The process involves identifying the high and low points of a price movement and then dividing the vertical distance by the key Fibonacci ratios. The resulting lines help pinpoint where the price might pull back.
Using Fibonacci Tools in Trading Platforms
Most trading platforms, like MetaTrader or TradingView, offer easy-to-use Fibonacci tools. Simply select the Fibonacci Retracement tool, click on the high and low points of your selected price range, and voilà—the key levels are plotted on your chart!
Common Fibonacci Retracement Levels Explained
- 23.6% Level: A minor retracement level that indicates a shallow pullback.
- 38.2% Level: A moderate retracement, often seen in trending markets.
- 50% Level: Although not a true Fibonacci level, it’s commonly used by traders as a significant halfway point.
- 61.8% Level: Known as the “golden ratio,” this level is crucial and often acts as a strong support or resistance.
The Significance of Key Levels
38.2%, 50%, and 61.8%: What Do They Mean?
These levels are not just random numbers—they represent key points where price action tends to react. A retracement to these levels could indicate that the trend will resume, while a break beyond these points might suggest a reversal.
Psychological Impact of Fibonacci Levels on Traders
Traders often attribute psychological importance to these levels. When many traders are watching the same levels, they can become self-fulfilling prophecies. It’s a bit like everyone showing up to the same party because they heard it’s going to be great.
Fibonacci Extensions
What Are Fibonacci Extensions?
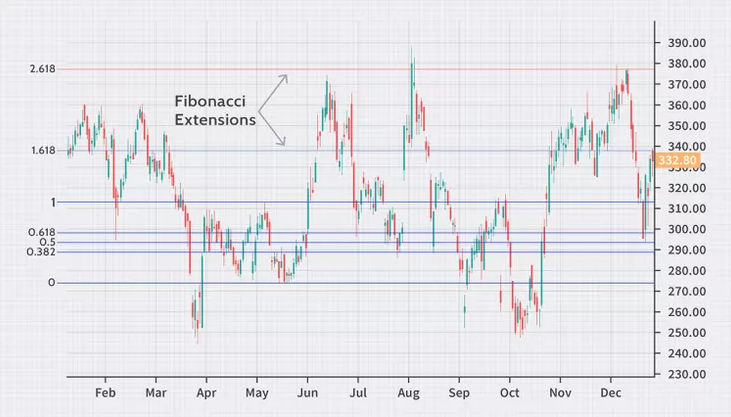
While retracement levels help you find potential entry points during a pullback, Fibonacci Extensions are used to identify target levels when the price extends beyond its previous swing high or low. They help you gauge how far a trend might go.

How to Use Fibonacci Extensions in Trading
Identifying Target Prices
Fibonacci Extensions project potential levels where the price could head next. They’re especially useful for setting profit targets. Common extension levels include 100%, 161.8%, and 261.8%.
Projecting Potential Market Movements
By using Fibonacci Extensions, you can anticipate where the price might extend after a retracement, helping you plan your exits more strategically.
Applying Fibonacci Extensions
Examples of Fibonacci Extensions in Real Trades
Imagine you’re in a strong uptrend, and after a minor pullback, you use Fibonacci Extensions to project that the price might reach the 161.8% level. You set your take profit at this level and watch as the market moves exactly as you anticipated. It’s like having a crystal ball!
Common Mistakes When Using Fibonacci Extensions
One common mistake is relying solely on Fibonacci without considering other market factors. It’s essential to use these tools in conjunction with other technical analysis methods to get a fuller picture.
How to Use Fibonacci Retracement and Extensions Together
Combining Retracement and Extension Levels
Using both retracement and extension levels together can create a powerful strategy. For example, you can enter at a retracement level and aim for an extension level as your target.
Strategies for Effective Use in Trading
A popular strategy is to enter trades at key retracement levels and set targets at extension levels. This approach helps you plan your trade from entry to exit, minimizing guesswork.
Practical Trading Tips
Setting Up Your Charts
Make sure your charts are clean and not overloaded with indicators. Use Fibonacci as a core tool and complement it with other indicators for confirmation.
Best Practices for Using Fibonacci in Different Markets
Fibonacci works well in trending markets but can also be useful in ranging markets with some tweaks. Always consider the broader market context before relying solely on Fibonacci levels.
Advanced Techniques
Using Fibonacci with Other Indicators
Combining Fibonacci with Moving Averages
Moving averages can help confirm Fibonacci levels. For instance, if a retracement level coincides with a moving average, it adds extra weight to that level as a potential support or resistance.
Using Fibonacci with RSI (Relative Strength Index)
Combining Fibonacci with RSI can give you an edge. If the RSI is showing overbought conditions at a Fibonacci extension level, it could be a signal to take profit.
Fibonacci Confluence
What is Fibonacci Confluence?
Fibonacci Confluence occurs when multiple Fibonacci levels from different timeframes or swings align closely. This alignment can act as a strong area of support or resistance.
How Confluence Enhances Trading Accuracy
When confluence occurs, it enhances the probability of the market respecting those levels, making it a great tool for precision in trading.
Common Pitfalls and How to Avoid Them
Over-Reliance on Fibonacci Levels
While Fibonacci is a fantastic tool, relying on it too much without considering other factors can lead to mistakes. Always keep the broader market context in mind.
Ignoring Market Context
Fibonacci levels are just one part of the puzzle. Ignoring market sentiment, news, or other technical indicators can result in incomplete analysis.
Real-Life Examples
Case Studies of Successful Trades Using Fibonacci
Successful traders often cite Fibonacci as a key part of their strategy. For instance, a trader might have caught a significant move by entering at the 61.8% retracement and exiting at the 161.8% extension.
Lessons Learned from Failed Trades
Not every trade goes as planned, even with Fibonacci. Learning from trades that didn’t work out is crucial, such as recognizing when a level fails and cutting losses quickly.
Conclusion
Fibonacci Retracement and Extensions are powerful tools that can significantly enhance your trading strategy. By understanding these key levels, you can better predict where the market might go, making your trades more strategic and less about guesswork. Remember, while Fibonacci can be your guide, always consider the full market picture to make informed decisions.
FAQs
1. How to use Fibonacci retracement and extension?
To use Fibonacci retracement, identify the high and low points of a trend, and apply the retracement tool to find potential pullback levels. For extensions, use the high and low of a trend along with a significant retracement to project potential targets for where the price might head next.
2. What is the difference between Fibonacci retracement and Fibonacci extension?
Fibonacci retracement levels help identify potential support and resistance during a pullback, while Fibonacci extensions project possible target levels beyond the initial trend, helping you set profit targets.
3. What are the extensions for Fibonacci trades?
Common extensions include 100%, 161.8%, and 261.8%. These levels help traders set target prices for where a trend might extend beyond its current range.
4. What are the best Fibonacci extension levels?
The most commonly used Fibonacci extension levels are 100%, 161.8%, and 261.8%. These levels are favored by traders for projecting future price moves and setting profit targets.
5. What is the golden rule of Fibonacci retracement?
The golden rule is to watch the 61.8% level—often called the “golden ratio.” It’s a key level where trends frequently pause or reverse, making it a critical point to monitor in trading.
6. Are Fibonacci extensions accurate?
While no tool is perfect, Fibonacci extensions are highly respected among traders for their ability to project potential price movements. Their accuracy improves when used with other technical analysis tools.
7. Do professional traders use Fibonacci?
Yes, many professional traders rely on Fibonacci levels for their simplicity and the insight they provide into potential support and resistance areas.
8. What are the strongest Fibonacci retracement levels?
The 38.2%, 50%, and 61.8% retracement levels are considered the strongest and most reliable for identifying potential support or resistance in a trending market.
9. Which timeframe is best for Fibonacci retracement?
Higher timeframes like daily, weekly, or even monthly charts are often preferred as they provide more reliable levels. However, Fibonacci can be applied across all timeframes depending on your trading strategy.
10. How to master Fibonacci retracement?
Practice makes perfect! Start by applying Fibonacci retracement on historical data to see how price reacts to different levels. Combine it with other technical indicators and pay attention to how it behaves in real time.
11. What is the best combination with Fibonacci retracement?
Combining Fibonacci retracement with moving averages, RSI, or trend lines can enhance its effectiveness by providing additional confirmation for entry and exit points.
12. How to draw a Fibonacci extension?
To draw a Fibonacci extension, select the extension tool, identify a significant price swing (high to low or low to high), and drag the tool to the end of the retracement move. This will plot extension levels based on the selected points.
13. When to use Fibonacci retracement and extension?
Use Fibonacci retracement to identify potential pullback levels during a trend, and Fibonacci extensions to project target levels for the continuation of the trend.
14. What are the disadvantages of Fibonacci retracement?
Fibonacci retracement levels are not always precise and can sometimes lead to false signals if used in isolation. It’s essential to consider the broader market context and use additional indicators for confirmation.
15. What is 100% Fibonacci retracement?
A 100% Fibonacci retracement occurs when the price retraces all the way back to the start of the previous trend move, essentially erasing the entire gain or loss. It’s a signal that the initial trend may be losing steam or reversing.


