Relative Strength Index (RSI)

Understanding the Relative Strength Index
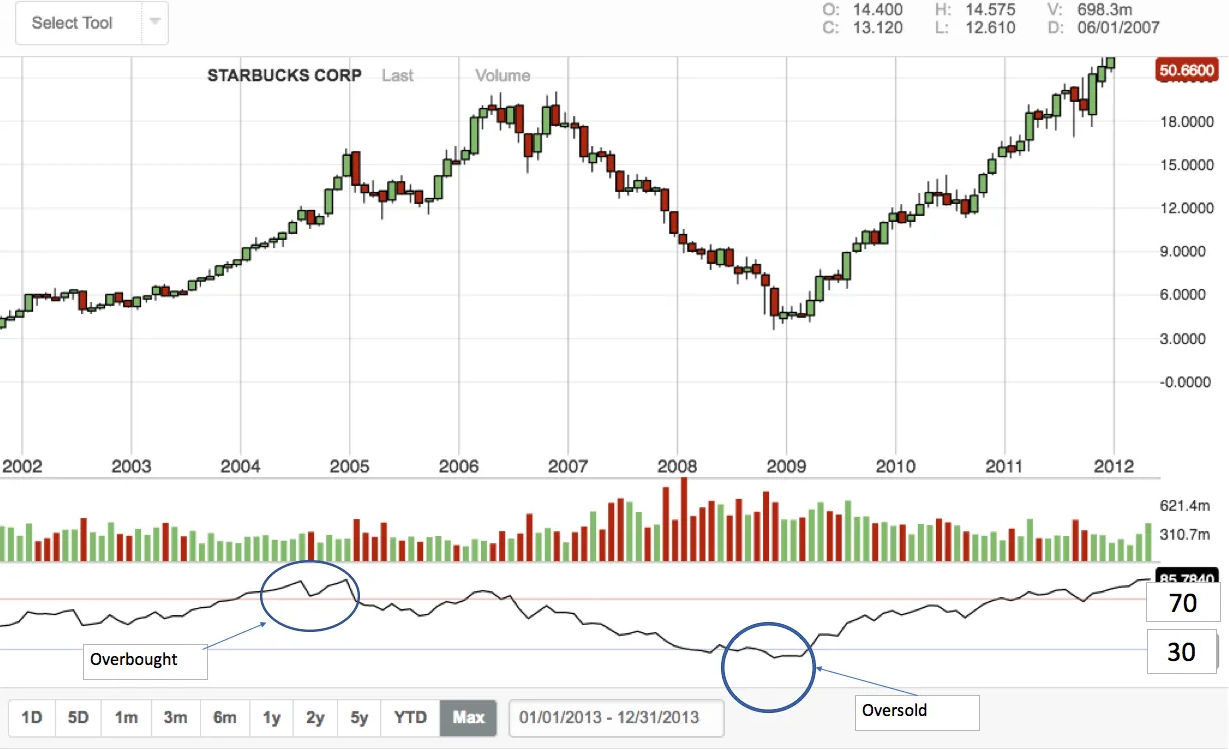
If you’ve ever dipped your toes into the world of trading, you’ve likely come across the term Relative Strength Index or RSI. But what exactly is RSI, and why should you care about it? Simply put, RSI is a momentum oscillator that measures the speed and change of price movements. It’s one of the most popular technical indicators used by traders to assess whether an asset is overbought or oversold.
What is RSI?
RSI is a technical indicator that oscillates between 0 and 100. It helps traders understand whether an asset is potentially overvalued or undervalued. If you see the RSI value above 70, it typically signals that the asset might be overbought. On the flip side, a value below 30 suggests that the asset could be oversold. Sounds simple, right? But there’s a lot more to RSI than just these numbers.
Why is RSI Important in Trading?
RSI is like a compass for traders. It provides crucial insights into market momentum, helping traders make informed decisions about when to enter or exit a trade. Whether you’re trading stocks, forex, or cryptocurrencies, understanding RSI can give you an edge in the market.
History of RSI
The Origins of RSI
The RSI wasn’t always part of the trader’s toolkit. It was developed in the late 1970s by a mechanical engineer turned technical analyst named J. Welles Wilder. Wilder introduced RSI in his book, “New Concepts in Technical Trading Systems,” and it quickly became a staple among traders.
Welles Wilder: The Creator of RSI
J. Welles Wilder is a name synonymous with technical analysis. Besides RSI, Wilder also developed other popular indicators like the Average True Range (ATR) and the Parabolic SAR. His work laid the foundation for many of the technical analysis tools we use today.
How RSI Works
The RSI Formula Explained
RSI may seem complex at first, but it boils down to a fairly straightforward formula:
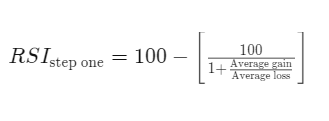
In simpler terms, RSI compares the magnitude of recent gains to recent losses, generating a value that oscillates between 0 and 100.
Calculation of RSI: A Step-by-Step Guide
- Determine the Average Gain and Average Loss over the specified period (usually 14 days).
- Calculate the Relative Strength (RS), which is the ratio of the Average Gain to the Average Loss.
- Plug the RS into the RSI formula to get the final RSI value.
What Does the RSI Value Indicate?
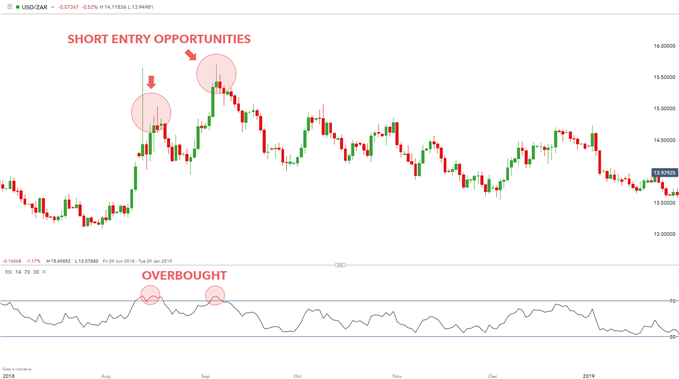
- RSI above 70: This suggests that the asset may be overbought, indicating a potential pullback or correction.
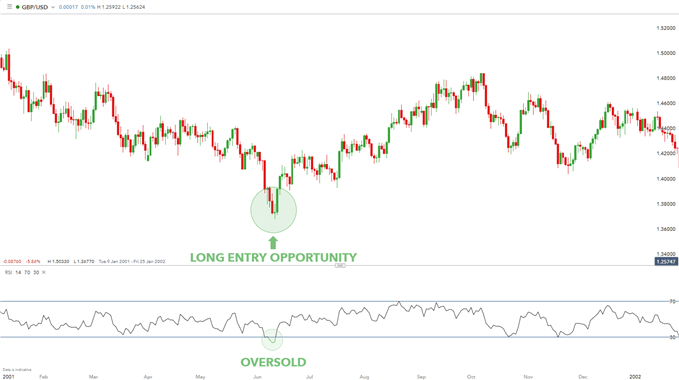
- RSI below 30: This suggests that the asset may be oversold, indicating a potential buying opportunity.
- RSI around 50: This is a neutral zone, indicating that the market is neither overbought nor oversold.
Interpreting RSI Values
Overbought vs. Oversold Conditions
When RSI hits extreme levels, it often signals that a reversal might be on the horizon. An RSI value above 70 is typically seen as a sign that the asset is overbought, and a correction could be imminent. Conversely, an RSI below 30 indicates oversold conditions, suggesting a potential bounce back.
The Significance of RSI Levels: 30, 50, 70
- 30 Level: Potentially oversold, possible reversal upward.
- 50 Level: A midpoint, often considered a neutral or equilibrium point.
- 70 Level: Potentially overbought, possible reversal downward.
Divergences: Bullish and Bearish Signals
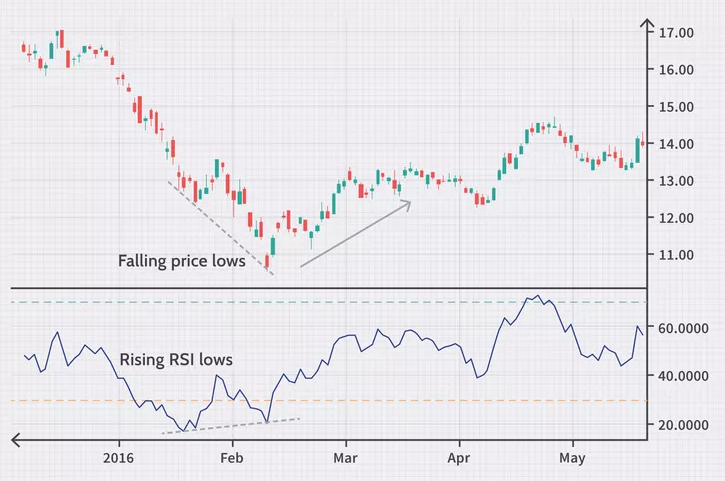
Divergences occur when the price of an asset moves in the opposite direction of the RSI. A bullish divergence happens when prices are falling, but RSI is rising, indicating a potential upward reversal. A bearish divergence occurs when prices are rising, but RSI is falling, suggesting a potential downward reversal.
RSI in Different Market Conditions
Using RSI in a Trending Market
In a strong trending market, RSI can stay in overbought or oversold territory for extended periods. For instance, during a strong uptrend, RSI might hover above 70 for some time. In such cases, it’s important not to rely solely on RSI but to use it in conjunction with other indicators.
Applying RSI in a Ranging Market
In a ranging market, where prices move sideways within a specific range, RSI can be highly effective. It helps traders identify potential reversal points at the top or bottom of the range, making it easier to trade within the range.
RSI Strategies for Traders
The 14-Day RSI Strategy
The 14-day RSI is the most common setting, as recommended by Welles Wilder. This period is generally considered optimal for capturing short- to medium-term price movements. Traders often look for RSI values crossing above or below the 30 or 70 levels to make their trading decisions.
Combining RSI with Other Indicators
RSI works best when combined with other technical indicators. For instance, combining RSI with moving averages or Bollinger Bands can provide more robust trading signals. This multi-indicator approach helps filter out false signals and improve the accuracy of trades.
RSI Swing Trading Strategy
Swing traders love RSI for its ability to pinpoint potential reversals. The basic idea is to buy when RSI crosses above 30 and sell when it crosses below 70. However, savvy traders often tweak these levels or use additional criteria to refine their entry and exit points.
RSI for Day Traders
Day traders can use RSI to make quick decisions based on intraday price movements. By focusing on shorter RSI periods (like 5 or 7), day traders can capture smaller price swings, making RSI an effective tool for high-frequency trading.
Common Mistakes When Using RSI
Misinterpreting RSI Signals
One of the biggest mistakes traders make is misinterpreting RSI signals. Remember, RSI can remain in overbought or oversold conditions for a while during strong trends. Just because RSI is above 70 doesn’t mean you should automatically sell.
Ignoring Market Context
Another common mistake is ignoring the broader market context. RSI should not be used in isolation. Always consider the overall market conditions, such as the presence of a strong trend or significant news events that could impact prices.
Over-Reliance on RSI
While RSI is a powerful tool, it’s not foolproof. Over-relying on RSI can lead to missed opportunities or premature trades. Always use RSI as part of a broader trading strategy, incorporating other indicators and market analysis.
Advanced RSI Techniques
RSI with Multiple Timeframes
Using RSI across multiple timeframes can provide a more comprehensive view of the market. For example, a trader might use RSI on both a daily and a weekly chart to confirm the strength of a signal. If RSI shows overbought conditions on both timeframes, it could indicate a stronger signal to consider.
Using RSI with Fibonacci Retracements
Combining RSI with Fibonacci retracement levels can help traders identify potential reversal points more accurately. When RSI aligns with key Fibonacci levels, it often strengthens the signal, providing a higher probability trade setup.
RSI and Support/Resistance Levels
RSI can also be used effectively with support and resistance levels. When RSI reaches overbought levels near a resistance point, it may indicate a strong selling opportunity. Conversely, oversold RSI levels near a support point may signal a buying opportunity.
RSI and Risk Management
Setting Stop-Loss Orders with RSI
RSI can be a useful tool for setting stop-loss orders. For instance, if you’re entering a trade based on RSI crossing above 30, you might set a stop-loss just below the most recent low to minimize your risk. This approach helps protect your capital while allowing room for the trade to develop.
Managing Risk with RSI Signals
RSI can also help manage risk by providing clear entry and exit points. By adhering to RSI signals and setting appropriate stop-loss levels, traders can minimize losses and protect their gains.
RSI and Different Asset Classes
Using RSI in Forex Trading
RSI is widely used in forex trading to analyze currency pairs. Given the high volatility in forex markets, RSI helps traders identify overbought and oversold conditions, making it easier to time entries and exits.
Applying RSI to Stocks
Stock traders often use RSI to gauge the momentum of individual stocks. By identifying overbought or oversold conditions, traders can better time their trades, especially during earnings seasons or other high-impact events.
RSI in Cryptocurrency Markets
Cryptocurrencies are known for their extreme volatility, making RSI an invaluable tool for crypto traders. Whether you’re trading Bitcoin, Ethereum, or altcoins, RSI can help you navigate the wild price swings typical of the crypto market.
Customizing RSI Settings
Adjusting the Period Length
While the 14-day period is standard, some traders prefer to adjust the RSI period to suit their trading style. Shortening the period to 7 days, for example, makes RSI more sensitive to price movements, which can be useful for short-term traders.
Fine-Tuning RSI for Different Trading Styles
Different trading styles may require different RSI settings. Day traders might opt for shorter periods to capture quick moves, while swing traders might prefer longer periods to avoid false signals. Experimenting with different settings can help you find what works best for your strategy.
RSI and Backtesting
The Importance of Backtesting RSI Strategies
Before applying any RSI-based strategy in live trading, it’s crucial to backtest it. Backtesting involves running the strategy through historical data to see how it would have performed. This step can help you identify potential pitfalls and fine-tune your approach before risking real money.
Tools and Software for RSI Backtesting
Several tools and platforms are available for backtesting RSI strategies, including MetaTrader, TradingView, and NinjaTrader. These platforms allow you to simulate trades based on historical data, helping you assess the viability of your RSI strategy.
Real-Life Examples of RSI in Action
Case Study: Successful RSI Trades
Consider a trader who used RSI to buy a stock that was in oversold territory with an RSI of 28. Over the next few weeks, the stock rallied, and the RSI moved up to 65. By following the RSI signals, the trader was able to capture a significant profit.
Analyzing Historical Market Data with RSI
Analyzing historical market data with RSI can provide valuable insights into how well this indicator works in different market conditions. By studying past price movements and corresponding RSI levels, traders can better understand how to apply RSI in future trades.
Pros and Cons of Using RSI
Advantages of RSI
- Easy to Use: RSI is straightforward and easy to interpret, making it accessible even for beginners.
- Versatile: RSI can be applied to various asset classes and timeframes.
- Effective in Ranging Markets: RSI excels in identifying overbought and oversold conditions in ranging markets.
Limitations of RSI
- False Signals: RSI can sometimes produce false signals, especially in strong trending markets.
- Lagging Indicator: RSI is a lagging indicator, meaning it reflects past price movements, which may not always predict future trends.
- Not Foolproof: RSI should not be used in isolation but rather as part of a broader trading strategy.
Conclusion
The Relative Strength Index (RSI) is a powerful tool in any trader’s arsenal. Whether you’re trading stocks, forex, or cryptocurrencies, understanding how to use RSI can significantly improve your trading decisions. However, like any tool, RSI has its limitations, and it’s essential to use it in conjunction with other indicators and market analysis to maximize its effectiveness. By mastering RSI and avoiding common pitfalls, you can enhance your trading strategy and increase your chances of success in the markets.
FAQs
- What is the best time frame for RSI?
- The 14-day RSI is the most commonly used timeframe, but the best timeframe depends on your trading style. Day traders might prefer shorter periods, while swing traders might opt for longer ones.
- Can RSI be used for long-term trading?
- Yes, RSI can be adapted for long-term trading by using longer periods, such as a 50-day RSI. This helps smooth out short-term fluctuations and provides a better view of long-term trends.
- How do you combine RSI with other indicators?
- RSI can be combined with moving averages, Bollinger Bands, or support/resistance levels to enhance its accuracy. Combining indicators can help filter out false signals and confirm trades.
- What is the difference between RSI and MACD?
- RSI measures momentum by comparing gains and losses over a specific period, while MACD (Moving Average Convergence Divergence) measures the relationship between two moving averages. Both are momentum indicators but provide different insights.
- Is RSI suitable for beginners?
- Absolutely! RSI is one of the easiest technical indicators to learn and use. Its simplicity and effectiveness make it an excellent choice for beginners.


