Understanding Volume Indicators: A Complete Guide for Traders

Introduction
Trading can feel like a roller coaster ride, can’t it? You’re constantly searching for that perfect strategy to make sense of the markets. Well, volume indicators might just be your ticket to a smoother ride. So, what exactly are volume indicators? In the simplest terms, they’re tools that help traders understand the level of buying and selling activity in a market. Think of them as a magnifying glass for market movements, giving you the inside scoop on where the action is happening. In this guide, we’ll dive deep into volume indicators, exploring what they are, how they work, and why they’re essential for any serious trader.
What is Volume in Trading?
Before we jump into the nitty-gritty of volume indicators, let’s start with the basics. Volume, in trading, refers to the total number of shares, contracts, or units of a security traded during a given period. It’s like the pulse of the market—when volume is high, it means there’s a lot of interest, and when it’s low, things are pretty quiet. But why does this matter? Well, volume is a key indicator of market strength. It tells you whether a price movement is backed by a lot of participants or just a few. And that can make all the difference when you’re trying to gauge the reliability of a trend.
Types of Volume Indicators
Not all volume indicators are created equal. There’s a whole buffet of them out there, each serving up its own insights and advantages. The trick is to find the one that fits your trading style. Here’s a quick overview of some popular types:
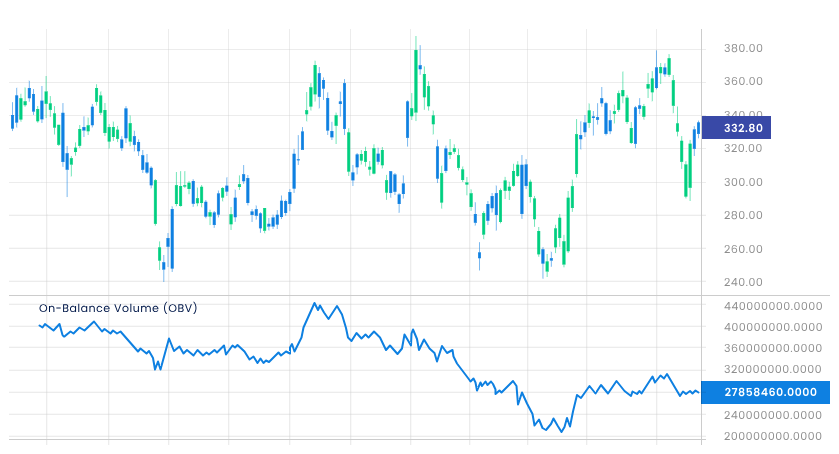
- On-Balance Volume (OBV): Tracks the cumulative buying and selling pressure by adding volume on up days and subtracting it on down days.
- Volume Weighted Average Price (VWAP): Gives the average price of a security, weighted by volume, over a specific period.
- Volume Moving Average (VMA): Averages volume over a set period to smooth out the data and highlight trends.
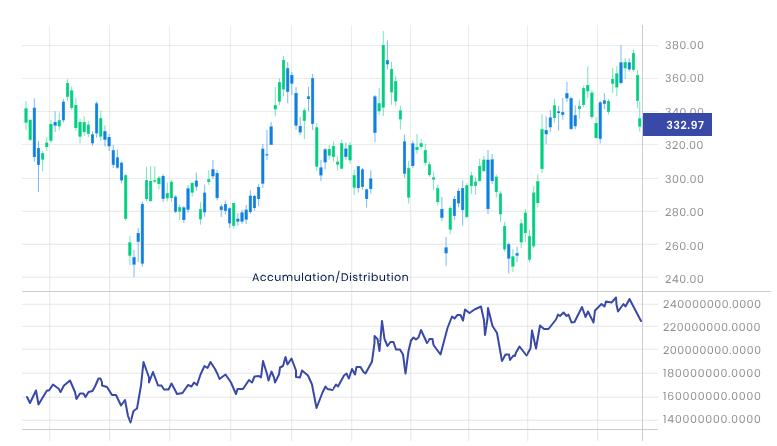
- Accumulation/Distribution Line: Combines price and volume to assess whether a stock is being accumulated (bought) or distributed (sold).
Each of these indicators provides unique insights into market activity, making them valuable tools in a trader’s toolkit.
The Basics: Volume and Price Relationship
One of the first things traders learn is that price and volume go hand in hand. When prices rise on high volume, it’s like the market is shouting, “This trend is real!” Conversely, if prices move on low volume, it’s more like a whisper—a sign that the trend might not be as strong as it appears. Understanding this relationship can be a game-changer, helping you spot potential reversals and confirm breakouts before they happen.
Common Volume Indicators Explained
Let’s take a closer look at some of the most commonly used volume indicators:
On-Balance Volume (OBV)
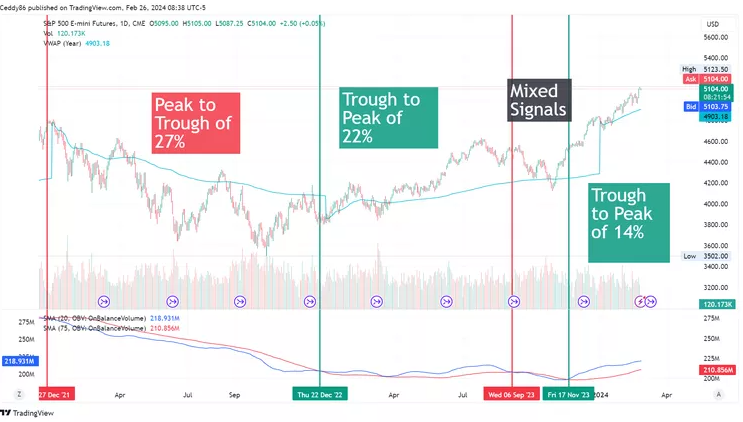
OBV is a favorite among traders because it’s simple yet powerful. By adding volume on days when the price goes up and subtracting it on days when the price goes down, OBV gives a running total that can help you spot trends. A rising OBV typically signals buying pressure, while a falling OBV suggests selling pressure.

Volume Weighted Average Price (VWAP)
VWAP is all about the average price of a security, adjusted for volume. It’s particularly popular with day traders who use it as a benchmark to judge whether they’re getting a good deal. If the current price is above the VWAP, it’s generally considered bullish; if it’s below, bearish.
Volume Moving Average (VMA)
VMA smooths out the volume data over a set period, making it easier to spot trends. By comparing the current volume to the VMA, traders can gauge whether the market is heating up or cooling down.
Accumulation/Distribution Line
This indicator combines price and volume to determine whether a stock is being accumulated or distributed. It’s a great way to gauge the underlying strength of a trend, especially when used alongside price charts.

Advanced Volume Indicators
If you’re ready to level up your trading game, consider exploring some of the more advanced volume indicators:
Chaikin Money Flow (CMF)
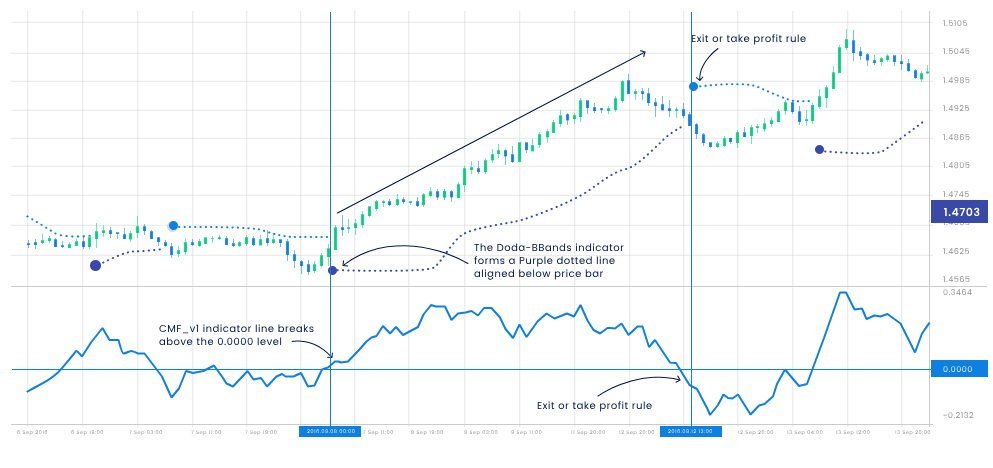
CMF looks at both price and volume to measure buying and selling pressure. A positive CMF indicates buying pressure, while a negative one points to selling pressure. It’s a great tool for spotting divergences between price and volume, which can signal potential trend reversals.

Klinger Oscillator
The Klinger Oscillator is a bit of a mouthful, but don’t let the name scare you off. It’s designed to predict price reversals by comparing volume with price movements over time. By tracking the long-term trend of volume flow, it helps traders spot shifts in buying and selling pressure.
Volume Price Trend (VPT)
VPT combines volume with price change to provide a cumulative running total that reflects the flow of funds into or out of a security. It’s particularly useful for confirming the strength of price trends.
How to Use Volume Indicators in Your Trading Strategy
So, how do you actually use these indicators in your trading? Well, it all starts with understanding market trends. Volume indicators can help you confirm the strength of a trend, spot potential reversals, and even identify breakouts before they happen. For example, if you see a stock breaking out of a key resistance level on high volume, that’s a strong signal that the move is likely to continue.
Benefits of Using Volume Indicators
Why bother with volume indicators at all? Simply put, they give you a clearer picture of what’s happening behind the scenes. By showing you the level of interest and participation in a given security, volume indicators can help you make more informed decisions about when to enter or exit a trade. Plus, they’re great for spotting trends early, giving you a head start on the competition.
Volume Indicators vs. Other Technical Indicators
Volume indicators are powerful, but they’re not the be-all and end-all of trading. They work best when used in conjunction with other technical indicators, like moving averages or relative strength index (RSI). By combining different tools, you can create a more comprehensive view of the market and improve your chances of making successful trades.
Common Mistakes When Using Volume Indicators
Of course, no tool is foolproof, and volume indicators are no exception. One common mistake traders make is relying too heavily on volume without considering other factors, like overall market conditions or fundamental analysis. It’s also easy to get caught up in short-term volume spikes, which can lead to impulsive trading decisions. The key is to use volume indicators as part of a broader strategy, rather than as your sole guide.

So, these examples are just a peek into how traders weave volume analysis into their futures trading strategies. It’s not just a plug-and-play situation; traders usually have a whole system going on, and a big part of that is rigorous backtesting. Think of it like a trial run—they test and tweak their strategies to make sure they hold up in the real world before putting any money on the line. It’s all about stacking the odds in their favor!
Practical Tips for Trading with Volume Indicators
Ready to get started with volume indicators? Here are a few tips to help you along the way:
- Set Up Your Charts: Make sure your trading platform is set up to display volume indicators alongside price charts. This will give you a clear view of how volume is affecting price movements.
- Look for Confirmation: Use volume indicators to confirm what you’re seeing in the price charts. For example, if a stock is in an uptrend but volume is declining, it might be a sign that the trend is losing steam.
- Practice Makes Perfect: Like any trading tool, volume indicators take time to master. Practice using them in a demo account before applying them to live trades.
Case Studies: Successful Use of Volume Indicators
To really bring the power of volume indicators to life, let’s look at some real-life examples:
- Case Study 1: A trader notices a stock breaking out of a resistance level on high volume, indicating strong buying interest. By entering the trade early, they’re able to ride the trend to a profitable exit.
- Case Study 2: In another instance, a trader spots a bearish divergence between price and the Chaikin Money Flow indicator. This signals a potential reversal, allowing the trader to exit a long position before the price drops.
These examples show how volume indicators can be used to spot key opportunities and avoid potential pitfalls.
Volume Indicators in Different Markets
Volume indicators aren’t just for stocks—they’re also useful in other markets, like forex and crypto. In the forex market, volume is often represented by tick volume, which counts the number of price changes in a given period. While it’s not a perfect measure of actual volume, it can still provide valuable insights. In the crypto world, volume indicators can help traders navigate the often volatile and unpredictable market conditions.
Tools and Platforms for Volume Analysis
To get the most out of volume indicators, you’ll need the right tools. Popular trading platforms like MetaTrader, TradingView, and Thinkorswim all offer robust volume analysis features. Look for platforms that allow you to customize your charts and combine multiple indicators for a more comprehensive view.
Conclusion
Volume indicators are like a secret weapon for traders, offering insights that can’t be gleaned from price data alone. By understanding and applying these tools, you can gain a deeper understanding of market dynamics and make more informed trading decisions. So whether you’re a seasoned pro or just starting out, adding volume indicators to your trading strategy is a smart move.
FAQ
- What is cryptocurrency volume trading?
Cryptocurrency volume trading involves analyzing the volume of trades (buying and selling) of cryptocurrencies to make informed trading decisions. It helps traders understand the market sentiment and the strength behind price movements. - Why is trading volume important in the crypto market?
Trading volume in the crypto market indicates the level of interest and activity in a particular cryptocurrency. High trading volume often suggests strong market sentiment and can confirm the strength of a price movement, while low volume may indicate weaker trends. - What are some tools and indicators for analyzing cryptocurrency trading volume?
Some popular tools and indicators for analyzing cryptocurrency trading volume include On-Balance Volume (OBV), Chaikin Money Flow (CMF), and Volume Weighted Average Price (VWAP). Trading platforms like TradingView and CoinMarketCap also offer detailed volume analysis features. - What are some strategies for high-volume cryptocurrency trading?
High-volume cryptocurrency trading strategies include day trading, scalping, and using volume breakouts to identify potential entry and exit points. Traders often look for significant volume spikes to confirm trends or reversals in the market. - How can I analyze trading volume in crypto to predict market movements?
To predict market movements in crypto, you can analyze trading volume alongside price action. Look for divergences between price and volume, such as a rising price with decreasing volume, which may signal a potential reversal. - What are some best practices for volume-based trading in cryptocurrencies?
Best practices for volume-based trading in cryptocurrencies include combining volume indicators with other technical analysis tools, monitoring market news and sentiment, and being cautious of volume spikes caused by non-market events like exchange outages or “whale” trades. - What are volume indicators for cryptocurrency trading?
Volume indicators for cryptocurrency trading include tools like the Accumulation/Distribution Line, Klinger Oscillator, and Volume Price Trend (VPT). These indicators help traders assess the strength of buying or selling pressure in the market. - How do market forces impact cryptocurrency volume dynamics?
Market forces such as news events, regulatory changes, and large institutional trades can significantly impact cryptocurrency volume dynamics. For example, positive news can lead to a surge in buying volume, while negative news might cause a spike in selling volume.


