What Is MACD? – Moving Average Convergence/Divergence

Introduction to MACD
Are you looking for a reliable indicator to enhance your trading strategy? The Moving Average Convergence Divergence (MACD) might be just what you need. MACD is one of the most popular tools among traders, providing insights into market momentum and helping to identify potential buy and sell signals. But what exactly is MACD, and why do traders rely on it? Let’s dive into this powerful indicator and explore how it can elevate your trading game.
Understanding the Basics of MACD
What is MACD?
MACD stands for Moving Average Convergence Divergence, a technical analysis tool used to gauge the strength and direction of a trend. It’s a momentum oscillator that shows the relationship between two moving averages of a security’s price. Traders love MACD because it’s versatile, simple to use, and applicable across various markets.
Components of MACD
To fully understand MACD, you need to break it down into its three main components:
- The MACD Line: This is the difference between the 12-day and 26-day Exponential Moving Averages (EMAs). It’s the core of the indicator, showing the trend’s direction and strength.
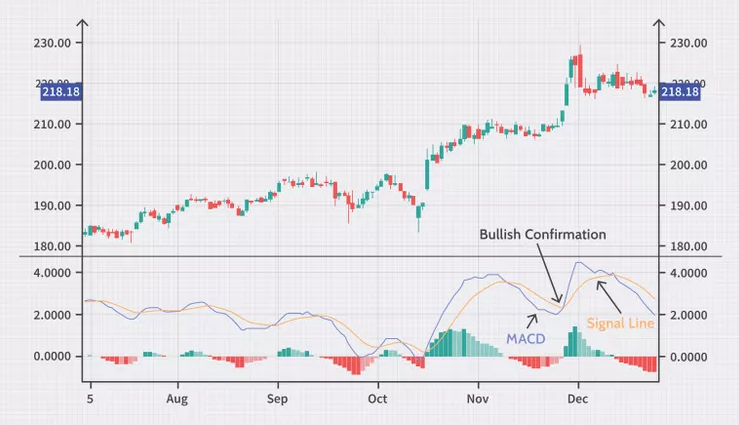
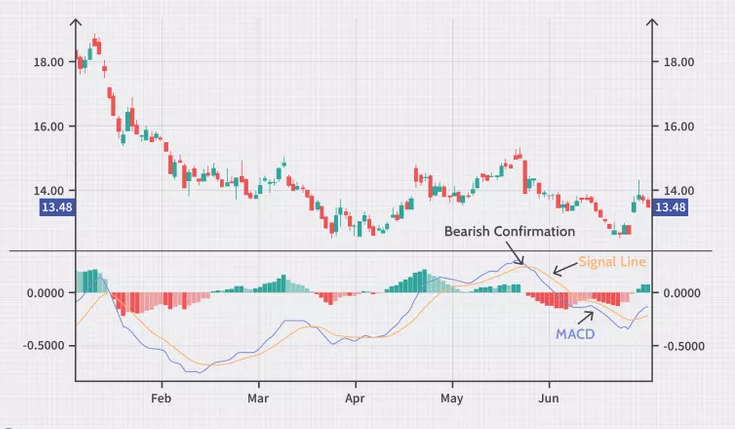
- The Signal Line: A 9-day EMA of the MACD Line. It acts as a trigger for buy and sell signals. When the MACD Line crosses above the Signal Line, it’s a bullish signal, and when it crosses below, it’s bearish.
- The Histogram: This represents the distance between the MACD Line and the Signal Line. The histogram is positive when the MACD Line is above the Signal Line and negative when below, providing a visual cue of momentum.

How MACD is Calculated
MACD is calculated by subtracting the 26-day EMA from the 12-day EMA. The Signal Line is then derived by calculating a 9-day EMA of the MACD Line. The histogram is simply the difference between the MACD Line and the Signal Line. While the math might seem complex, most trading platforms calculate and display these values automatically, making it easy for traders to use.
MACD=12-Period EMA − 26-Period EMA
How to Interpret MACD
The Meaning of Convergence and Divergence
The terms “convergence” and “divergence” refer to how the two moving averages (the 12-day and 26-day EMAs) interact:
- Convergence: When the two EMAs are moving towards each other. This suggests a weakening trend.
- Divergence: When the EMAs are moving apart, indicating a strengthening trend.


Understanding the MACD Line and Signal Line Crossovers
One of the most common ways traders use MACD is by looking for crossovers between the MACD Line and the Signal Line:
- Bullish Crossover: When the MACD Line crosses above the Signal Line, it’s considered a buy signal.
- Bearish Crossover: When the MACD Line crosses below the Signal Line, it signals a potential sell opportunity.
Think of the MACD as a tool to help you decide when to jump in or out of a trade. When the MACD line dips below the signal line, it’s usually a hint that the market might be turning bearish—a sign it could be time to consider selling. On the flip side, if the MACD rises above the signal line, that’s generally a bullish sign, suggesting the asset might be gearing up for an upward move. Now, these crossovers pack a bigger punch when they align with the current trend. For example, if the MACD pops above its signal line during a quick pullback in an overall uptrend, it’s a pretty good confirmation that the uptrend is likely to keep going.


Analyzing the Histogram
The histogram can provide early signals of trend changes. When the histogram bars begin to shrink, it could be a sign that the trend is losing strength. Conversely, increasing bars suggest growing momentum.
MACD Settings
Standard MACD Settings (12, 26, 9)
The default MACD settings are 12, 26, and 9, where:
- 12 represents the 12-day EMA.
- 26 is the 26-day EMA.
- 9 is the 9-day EMA used for the Signal Line.
These settings are widely used and provide a good balance between sensitivity and reliability.
Adjusting MACD Settings for Different Trading Styles
Depending on your trading style, you might want to tweak the MACD settings:
- Day Trading: Shorten the periods (e.g., 8, 17, 5) to make the MACD more sensitive to price changes.
- Swing Trading: Stick with the default settings or slightly adjust them to better suit medium-term trends.
- Long-term Investing: Lengthen the periods (e.g., 19, 39, 9) to smooth out the MACD, focusing on major trends.
MACD Trading Strategies
Basic MACD Crossover Strategy
The simplest way to use MACD is to trade the crossovers between the MACD Line and the Signal Line:
- Buy: When the MACD Line crosses above the Signal Line.
- Sell: When the MACD Line crosses below the Signal Line.
MACD and RSI Combination Strategy
Combining MACD with the Relative Strength Index (RSI) can improve your trading decisions. MACD identifies the trend, while RSI helps determine overbought or oversold conditions, giving you a more comprehensive view.
MACD Divergence Strategy
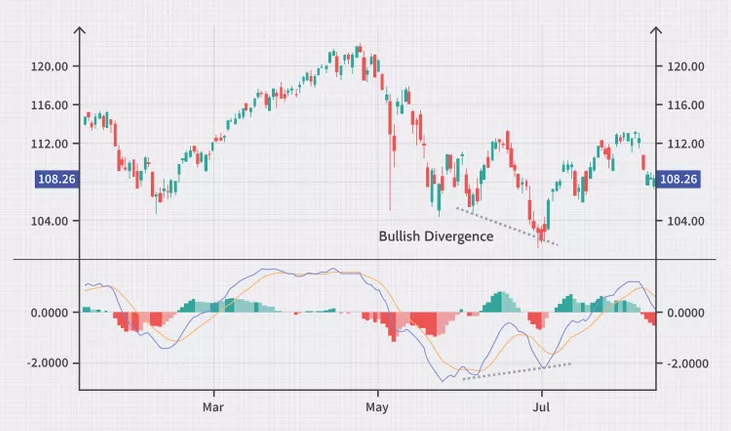
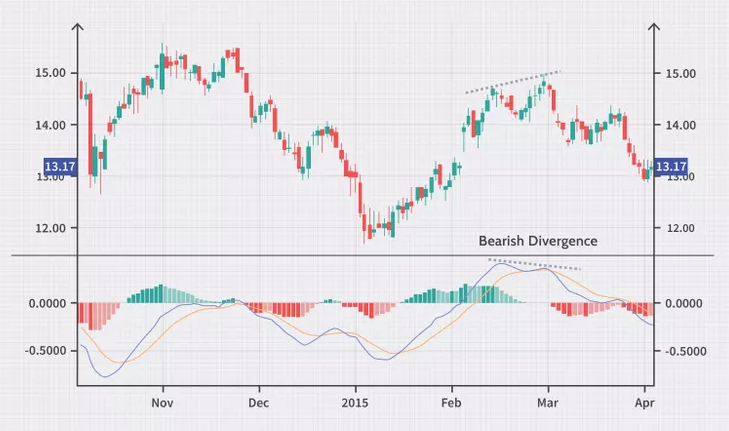
Divergences between the MACD and price can signal potential reversals. If the price makes a new high but the MACD does not, it might indicate a bearish reversal is coming. Similarly, a bullish divergence occurs when the price hits a new low, but the MACD forms a higher low.
MACD with Moving Averages
Some traders enhance MACD by adding simple moving averages (SMAs) to their charts. For example, using a 50-day SMA with MACD can help filter out noise and focus on significant trends.
Advantages of Using MACD
Flexibility Across Time Frames
MACD works well on various time frames, making it suitable for day traders, swing traders, and long-term investors alike. Its adaptability is one of the reasons for its popularity.
Combining MACD with Other Indicators
MACD can be combined with other indicators like Bollinger Bands, Moving Averages, or Fibonacci retracement levels to create a more robust trading strategy.
Simplicity and Effectiveness
Despite its power, MACD is relatively simple to understand and apply, making it accessible even for beginner traders.
Common Mistakes with MACD
Over-relying on MACD Without Confirmation
One common mistake is relying solely on MACD without considering other factors. Always use MACD in conjunction with other indicators or price action analysis to confirm signals.
Misinterpreting Divergences
Divergences can be tricky and are not always reliable. It’s important to look at the bigger picture and not just the divergence alone.
Ignoring Market Conditions
MACD works best in trending markets. In sideways or choppy markets, it can give false signals. Understanding the market context is crucial when using MACD.
Limitations of MACD
Lagging Nature of MACD
Because MACD is based on moving averages, it tends to lag behind the price. This can lead to late entries or exits, especially in fast-moving markets.
False Signals in Sideways Markets
In markets without a clear trend, MACD can produce false signals. Traders should be cautious and consider using additional indicators to confirm trends.
Not a Standalone Indicator
While powerful, MACD should not be used in isolation. It’s most effective when combined with other tools and analysis techniques.
Case Studies: MACD in Action
Real-life Examples of Successful Trades Using MACD
To see MACD in action, let’s look at a few real-life examples where traders used this indicator to make profitable trades. In one case, a trader used a MACD crossover to buy into a stock just before a major uptrend, resulting in significant gains.
Analyzing Failed Trades and What Went Wrong
On the flip side, not every trade goes as planned. We’ll examine a scenario where a trader misinterpreted a MACD signal, leading to a loss. Understanding these mistakes can help you avoid similar pitfalls.
Customizing MACD
How to Tweak MACD for Better Performance
If the standard MACD settings aren’t working for you, don’t be afraid to experiment. Adjusting the periods or combining MACD with other indicators can fine-tune its performance to better suit your trading style.
Advanced Techniques in Using MACD
For those looking to get more out of MACD, advanced techniques like using multiple time frames or incorporating MACD into a broader trading system can enhance your strategy.
MACD in Different Markets
Using MACD in Stock Trading
MACD is particularly effective in stock trading, where it can help identify trend changes and momentum shifts, giving traders an edge in the market.
Applying MACD in Forex
In the Forex market, MACD can be a valuable tool for spotting currency pair trends and potential reversals, especially when combined with other indicators.
MACD in Cryptocurrency Trading
Cryptocurrencies are known for their volatility, and MACD can help navigate these choppy waters by identifying the strongest trends and best entry points.
Tools and Platforms for MACD
Best Trading Platforms with MACD Integration
Several trading platforms offer excellent MACD integration, including MetaTrader, TradingView, and Thinkorswim. These platforms provide robust charting tools and customizable settings.
Recommended Charting Tools for MACD Analysis
For those who prefer more detailed analysis, advanced charting tools like TradeStation or NinjaTrader offer in-depth MACD customization and visualization options.
MACD vs Other Indicators
MACD vs RSI
While MACD focuses on trend strength and direction, RSI is all about overbought and oversold conditions. Both are valuable, but they serve different purposes in a trading strategy.
MACD vs Stochastic Oscillator
The Stochastic Oscillator is another momentum indicator, but it compares the closing price to a range of prices over a specific period. MACD, on the other hand, compares moving averages, making it more trend-focused.
MACD vs Bollinger Bands
Bollinger Bands are volatility indicators, showing price relative to a moving average and standard deviation bands. MACD complements Bollinger Bands by providing momentum and trend direction insights.
Conclusion
In the world of trading, the Moving Average Convergence Divergence (MACD) is a powerful tool that offers valuable insights into market trends and momentum. While it’s a versatile and effective indicator, it’s important to use MACD in conjunction with other tools and analyses to make the most informed trading decisions. Whether you’re a day trader, swing trader, or long-term investor, understanding how to use MACD can give you a significant edge in the markets.
FAQs
1. What is the best setting for MACD?
The standard settings (12, 26, 9) are widely used and provide a good balance for most trading styles. However, you can adjust these settings based on your specific needs.
2. Can MACD be used for day trading?
Yes, MACD can be used for day trading, especially when you adjust the settings to make the indicator more sensitive to shorter time frames.
3. How reliable is MACD in volatile markets?
MACD can be less reliable in highly volatile or sideways markets, where it may produce false signals. It’s best to use it in trending markets or alongside other indicators.
4. What does it mean when MACD crosses above the signal line?
When the MACD Line crosses above the Signal Line, it’s generally considered a bullish signal, indicating potential upward momentum.
5. Is MACD suitable for beginners?
Absolutely! MACD is one of the most beginner-friendly indicators, offering straightforward signals that can be easily interpreted even by new traders.


